ETL 1110-1-175
30 Jun 97
converting, or back-transforming, kriging esti-
(3) A spherical model also was fit to an
mates, the kriging estimates and the kriging stan-
anisotropic variogram at an angle of 240 deg
dard deviations, in log space, were used to estimate
counterclockwise to the east-west baseline. The
the one-sided 95th percentile at each kriging-
variogram had a nugget of 0.05 indicator units
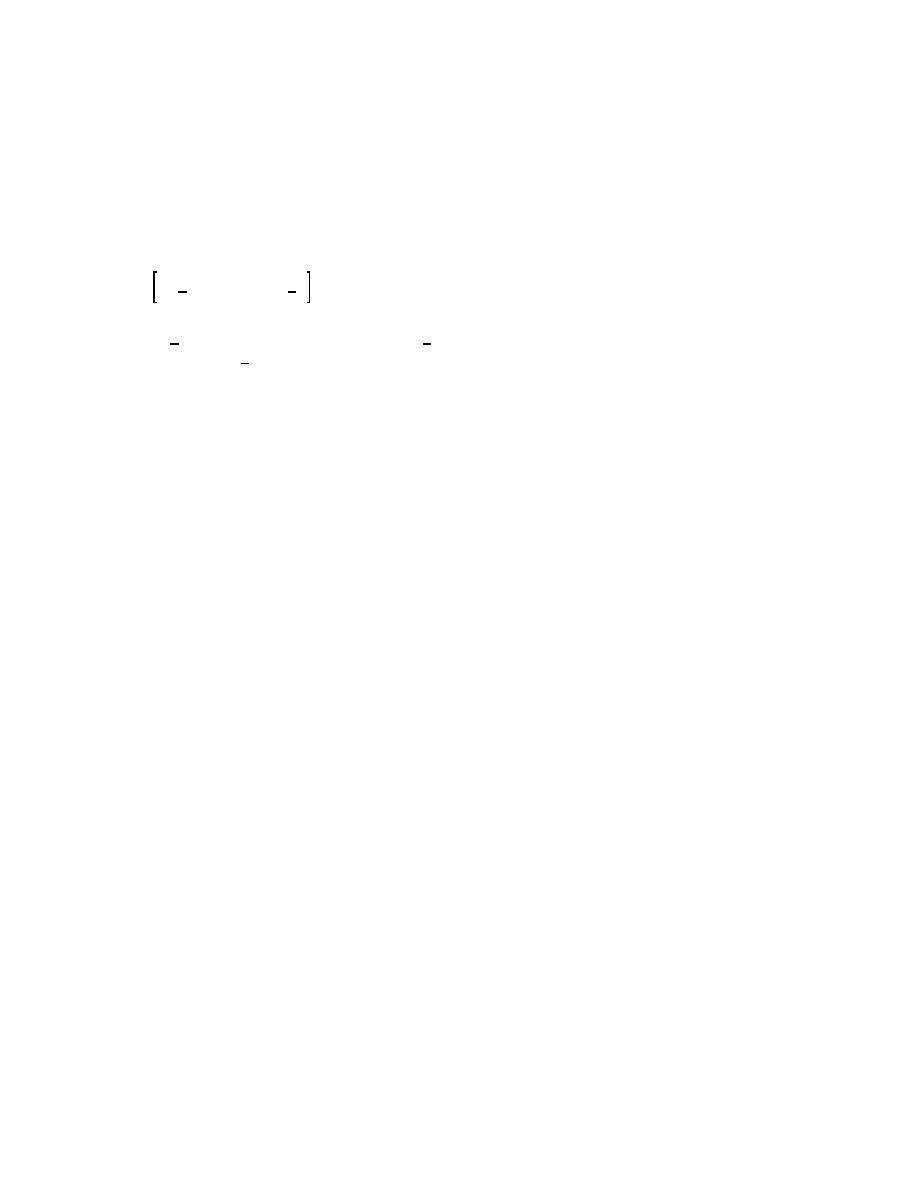
estimate location according to the formula:
squared, a sill of 0.25 indicator units squared, and
a range of 213 m [Figure 5-10b and Table 5-1
^
C 0.95 =
(water quality B].
(5-1)
i. The established variogram, along with the
exp Z (x0) % 1.645FK (x0)
^
indicator transform of the measured data, was used
to produce ordinary kriging estimates for the same
^
where (Z x0) ( is the kriging estimate at location x0,
grid and search criteria as the first water-quality
in log space, and Fk(x0) is the corresponding krig-
example. A gray-scale map of the kriging esti-
mates is shown in Figure 5-11. The kriging indi-
ing standard deviation in log space. The resulting
cator map provides a gridded estimate for the
map is shown in Figure 5-9d. Such a map can be
probability of contaminant values being less than
used to indicate areas where the true concentration
the indicator cutoff, which is a concentration of
has only a 5-percent chance of exceeding the value
270 in this example.
shown.
j. The cutoff value selected for the preceding
h. To perform indicator kriging, the indicator
indicator kriging example is probably higher than
transformation, as described in Chapter 2, was
many investigators involved in HTRW site investi-
applied. An indicator cutoff equal to the median
gations would like to use. In this case the number
value of 270 for the untransformed measured data
of measurements [66 in Table 4-1 (water qual-
was selected. The model for indicator kriging esti-
ity B)] used in this example, which is probably a
mates the probability that the concentration would
high number of measurements for typical HTRW
be less than the indicator cutoff. The techniques
site investigations, would not permit construction
described in Chapter 4 were used to guide the fol-
of an indicator variogram for indicator values
lowing steps in variogram construction:
much lower than the median. An alternative to this
problem would be to assume that the log-
(1) No trends were indicated during prelimi-
transformed kriging model developed in the first
nary exploration, and ordinary kriging was tenta-
water-quality example is correct and to rely on the
tively selected as the appropriate technique.
kriging estimates from that model to determine
areas greater than or less than some indicator
(2) A spherical model was used to fit an
value. The same estimates also could be used to
anisotropic variogram at an angle of 150 deg
compute the probability that the concentration was
counterclockwise to the east-west baseline. The
less than some arbitrarily selected value.
variogram had a nugget of 0.05 indicator units
squared, a sill of 0.25 indicator units squared, and
a range of 610 m [Figure 5-10a and Table 5-1
(water quality B)].
5-33


 Previous Page
