ETL 1110-2-365
31 Aug 94
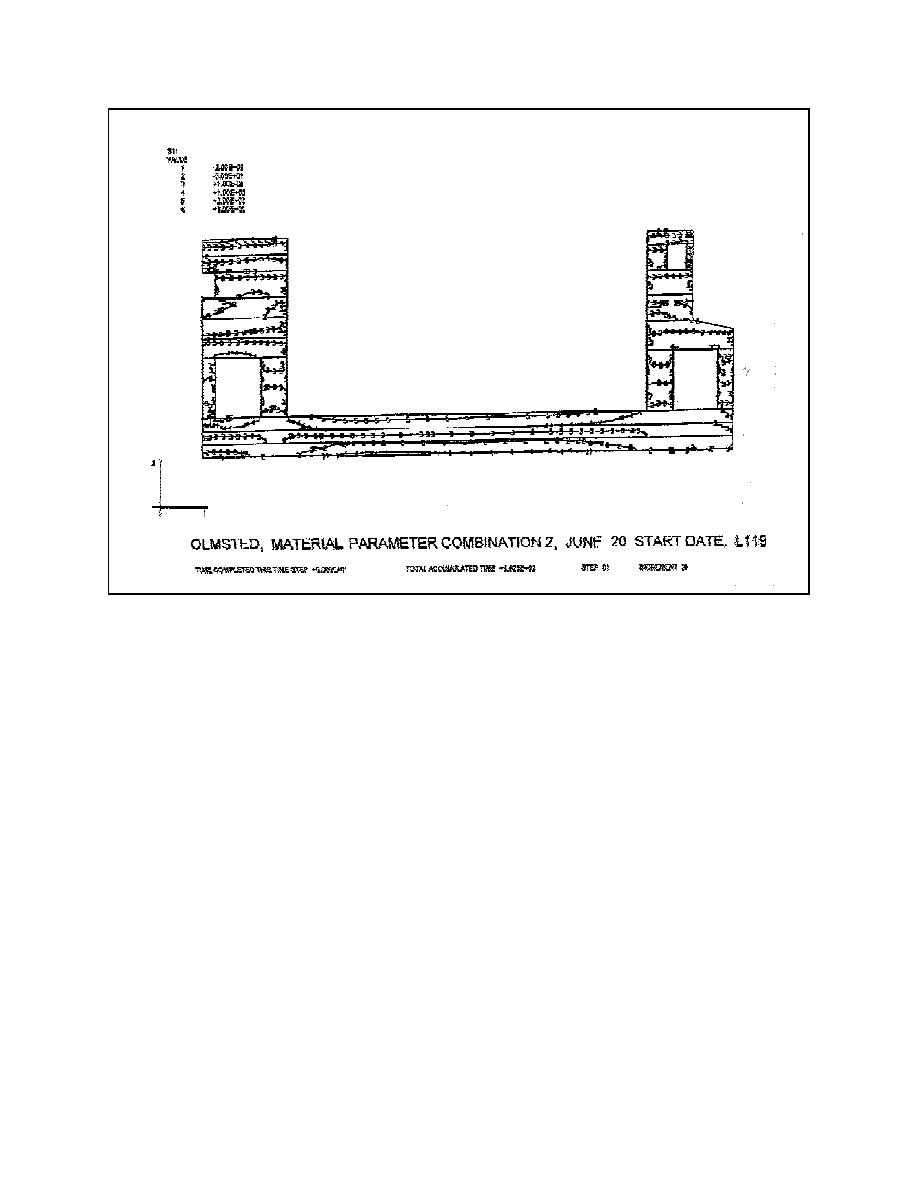
Figure A-3.
Principal stress contour example
(5) Crack location plots. This type of plot,
lifts. Determination of the maximum value of a
Figure A-9, is available only through the use of
specific result (i.e., stress, strain) and its time of
ANACAP-U (ANATECH Research Corp 1992) and
occurrence is useful in determining which section or
shows locations of all cracks in the structure at a
location to plot and the corresponding time.
specified time. When displayed at a sufficiently large
scale, crack status (open or closed) may be observed.
(4) Displaced shapes. Displaced shape plots,
For 2-D analyses, open cracks are denoted with dou-
Figure A-8, can be used to see the overall response of
ble lines, while closed cracks are denoted with single
the structure due to the applied load. Due to the
lines. For 3-D analyses, open cracks are denoted
methods used to implement incremental construction
with two concentric circles, while closed cracks are
in ABAQUS, displaced shape plots typically show
denoted with single circles. Typically, a crack loca-
model induced distortions at lift interfaces. These
distortions are plotting discontinuities resulting from
tion plot is developed for the last timestep in an
the display of total nodal displacements in the newly
analysis. This can show the extent of cracking
initialized lift relative to their displaced locations
throughout the structure and whether the cracks are
instead of their original undisplaced locations. This
open or closed at this time. Using this information,
misapplication of displacement is for ease of plotting
other crack plots can be developed for times when
and occurs only in plotting of the displaced shape.
cracks initially form or for use in tracking further
Nodal displacements are handled correctly in the
crack development.
analysis during each timestep by ABAQUS.
A-24


 Previous Page
