ETL 1110-2-367
31 Mar 95
E-6.
Plan Summaries
E-7.
Graphical Displays
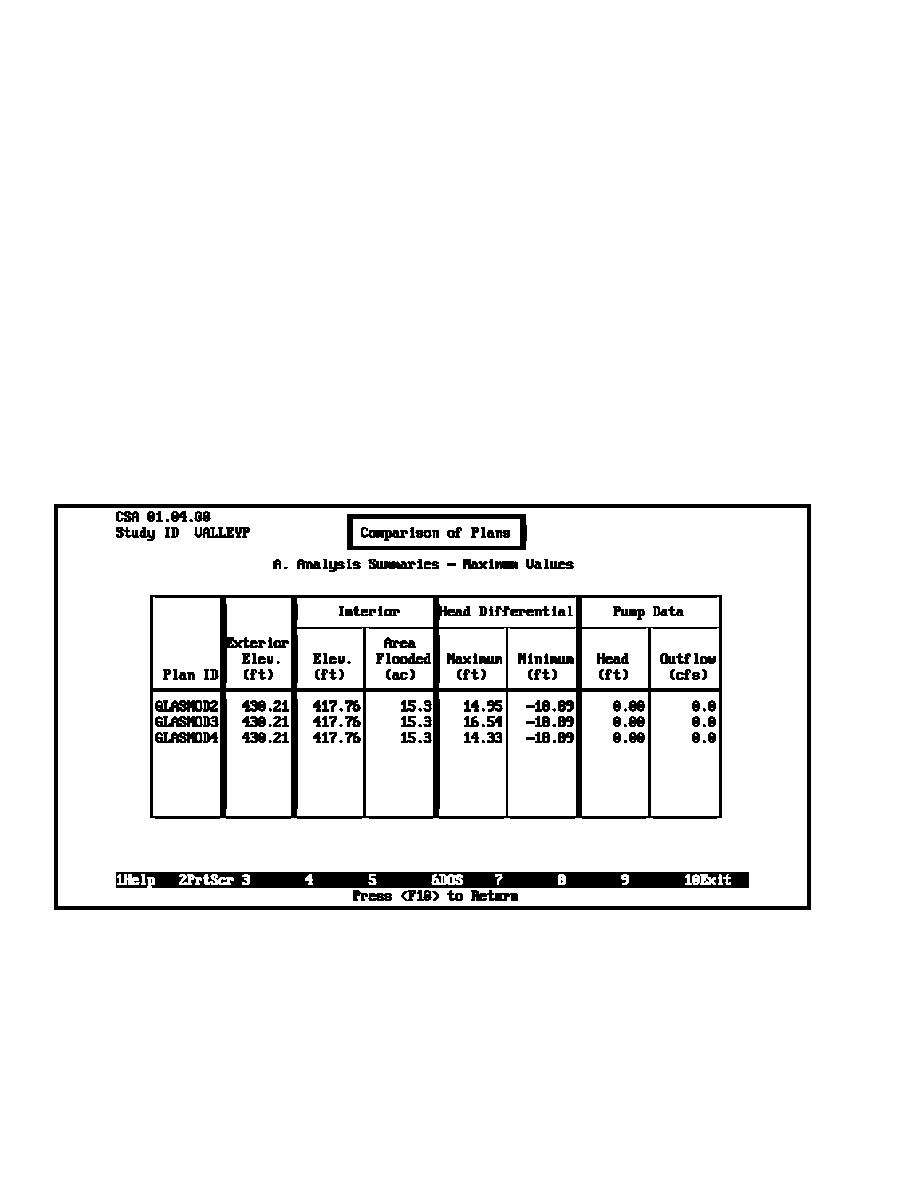
Individual CSA runs are obviously quite lengthy. One
Another valuable feature of the HEC-IFH Package is the
CSA run for a Valley Park subarea, using 1-hr intervals with
ease of preparing report quality graphical displays of key
40 years of record, yields about 3,900,000 bytes of output.
information. Figures E-8 through E-13 give examples of
The total output for the various Valley Park plans now
graphical information used for the Valley Park FDM. These
retained in the computer requires about 85 MB of storage,
figures show the monthly maximum, average and minimum
a veritable "mountain" of paper. Thus an extremely valuable
ponding stages, and exterior river stages for the period of
feature to analyze output is the plan summary tables
record. They also show the stage-duration curves for both
available within HEC-IFH, which allow the easy comparison
annual maximum outflow and acres flooded in the ponding
of several different plans or scenarios. Examples of some
area, and the interior stage-frequency relationship from the
plan summary displays are shown in Figures E-5, E-6, and
CSA.
E-7. These results compare interior elevations, area
E-8. Summary
flooded, stage-frequencies, etc. for the Glass Plant subarea
for gravity outflow conditions of two 48-in. outlets
HEC-IFH proved to be a useful tool in analyzing the
(GLASMOD1), two 54-in. outlets (GLASMOD2), and two
Valley Park interior area. The St. Louis District will
60-in. outlets (GLASMOD3). As is readily apparent, there
continue to use HEC-IFH for interior studies.
is no significant improvement in the results for larger gravity
outlets than the minimum facility (two 48-in. outlets).
Figure E-5. Maximum values for study plans
E-8


 Previous Page
