ETL 1110-2-537
31 Oct 97
and at Yl = 12.33 is
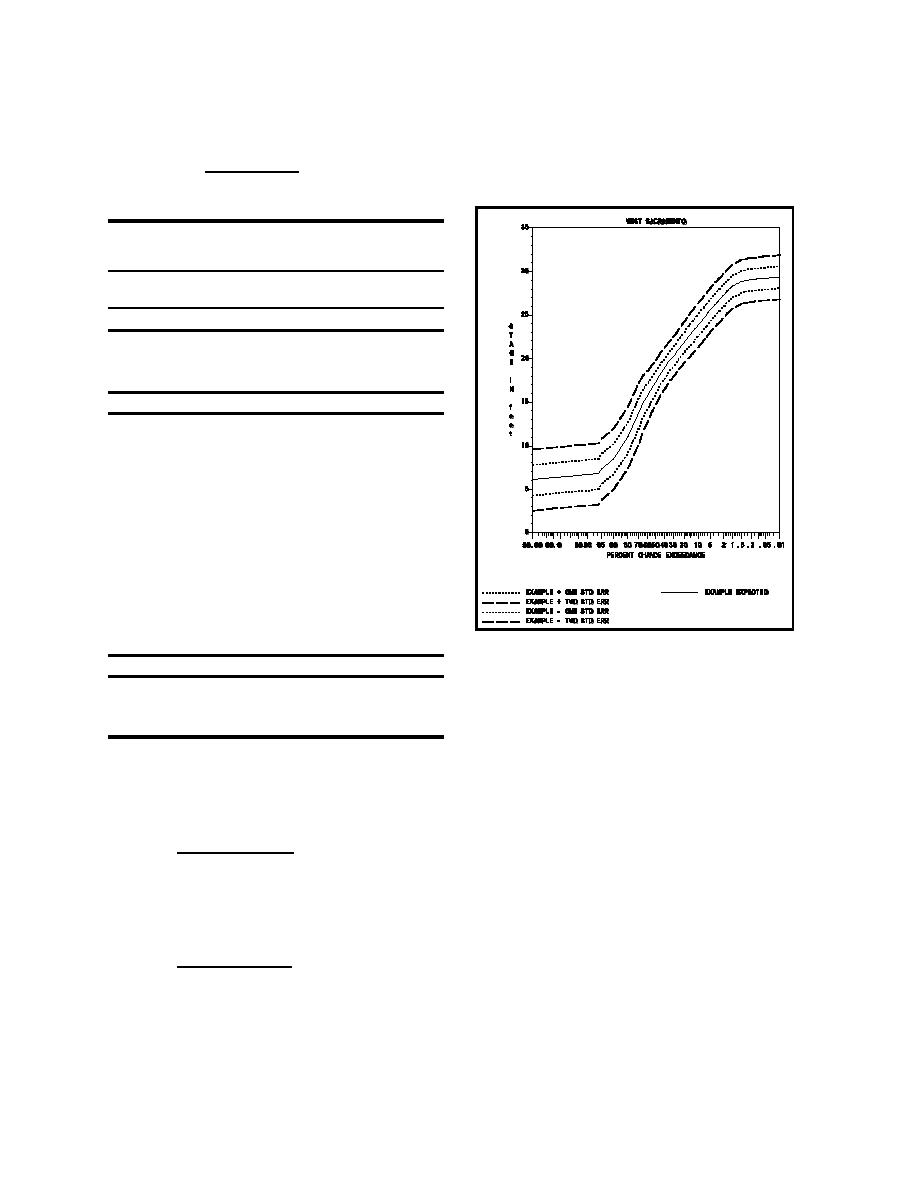
uncertainty distribution. The resulting confidence
limits at plus or minus one and two standard
deviations associated with the uncertainty calculation
0.333 & 0.238
fY ( Ym ) -
(13)
' 0.0498
are shown in Figure 3 for the entire frequency curve.
22.11 & 20.52
Table 4
Mean and Standard Deviations of Uncertainty
Distributions Computed Via Order Statistics
Statistics of Uncertainty
Frequency Curve
from Incomplete Beta
Quantile
Mean
Std Dev
0.905
8.45
9.15
1.52
0.857
9.10
10.13
1.96
0.810
10.80
11.26
2.26
Beginning of data used in interpolation
0.762
12.33
12.39
2.35
0.714
13.53
13.47
2.31
0.667
14.73
14.48
2.16
0.619
15.52
15.40
1.98
0.571
16.32
16.21
1.87
0.524
17.07
16.98
1.75
0.476
17.80
17.71
1.66
0.429
18.53
18.40
1.60
0.381
19.20
19.07
1.53
0.333
19.90
19.76
1.52
0.286
20.52
20.46
1.53
0.238
21.29
21.18
1.54
Figure 3. Stage-frequency curve with
End of data used in interpolation
confidence limits
0.190
22.11
21.93
1.53
0.143
23.00
22.67
1.48
e. Example 2.
0.095
24.13
23.48
1.38
The equivalent record lengths are obtained using Sm
(1) The estimated uncertainty distribution for a
= 1.54 and p = 0.286 in Equation 8
regulated frequency curve on the Savannah River was
calculated, resulting in the confidence limits shown in
Figure 4. The frequency curve was based on informa-
tion from a long inflow series, historic information,
0.286 ( 1 & 0.286 )
- 35
nm -
(14)
observed regulated flows, and model simulations. The
2
2
( 1.53 ) ( 0.0498 )
equivalent record length from this information was
believed to be about 190 years.
and Sl = 2.35 and p = 0.762 in Equation 9
(2) The interesting aspect of this example is that
the uncertainty about the frequency curve is negligible
0.762 (1 & 0.762 )
nm -
- 27
as the frequency curve flattens near the 50 percent
(15)
2
2
2.35 ( 0.035 )
chance exceedance probability event. This is indicated
by the convergence of the confidence limits in
A straightforward application of the normal
Figure 4.
distribution can now be used to extrapolate the
9


 Previous Page
