ETL 1110-2-544
31 Jul 95
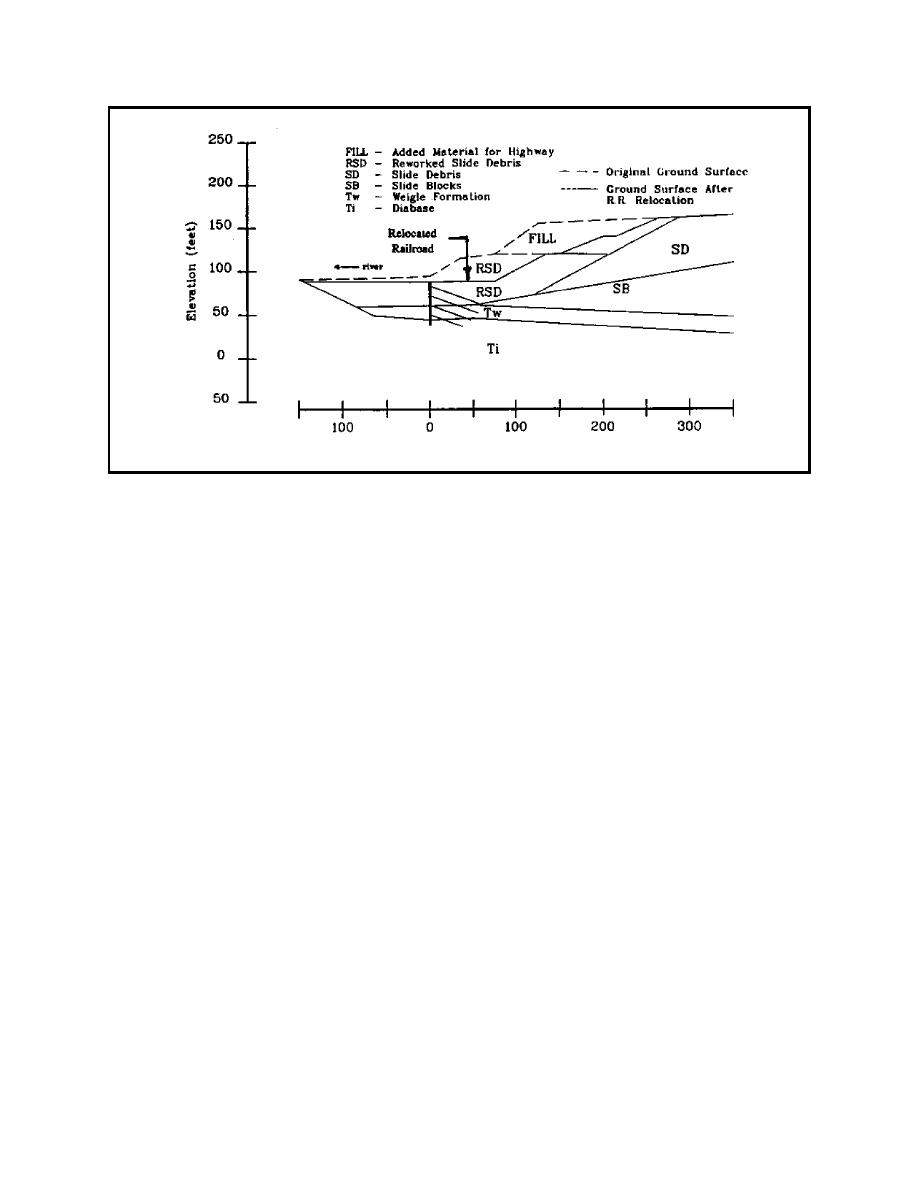
Figure 2. Geologic profile for analysis of Bonneville tieback wall
commenced, and tiebacks were installed at a grid
has 395 elements and 389 nodes, and it extends a
spacing of approximately 10 ft by 10 ft.
considerable distance away from the wall. Two-
dimensional elements were used to model the soil and
b. Purposes of the SSI analysis. SSI analysis of
rock units and the reinforced concrete wall. Bar
the tieback wall were performed by Mosher and
elements were used to represent the tie-backs. Bar
Knowles (1990) for three principal purposes:
elements were also employed as "strain gages" on
either side of the wall so that extreme fiber stresses
(1) To confirm previous design studies based on
and bending moments could be calculated in post-
limit equilibrium procedures and beam on elastic foun-
processing. Interface elements were used to
dation analyses.
allow slip between the wall and adjacent materials.
(2) To predict wall performance during exca-
e. Construction sequence modeling. A series of
vation and tieback installation.
analysis steps were used to develop the initial in situ
stresses prior to construction. These steps included a
(3) To assist in the interpretation of instrumen-
gravity turn-on analysis followed by several steps to
tation results.
establish the initial ground surface slope. The
displacements were set to zero at this point to represent
c. Material behavior model and property
the zero displacement condition prior to beginning
values. The hyperbolic model (Duncan and Chang
construction.
1970) as implemented in SOILSTRUCT (Clough and
Duncan 1969, and Ebeling et al. 1990) was selected
The construction sequence was then modeled as
for the soil and rock units at the site. Material prop-
follows:
erty values were obtained from interpretation of
laboratory test results. Structural materials were
(1) Excavate to the level of the top of the wall
assumed to behave in a linear elastic manner.
and the railroad grade.
d. Mesh details. The finite element mesh used
(2) Excavate and place concrete for the retaining
for the analyses is shown in Figure 3. The mesh
wall.
A-7


 Previous Page
