ETL 1110-2-563
30 Sep 04
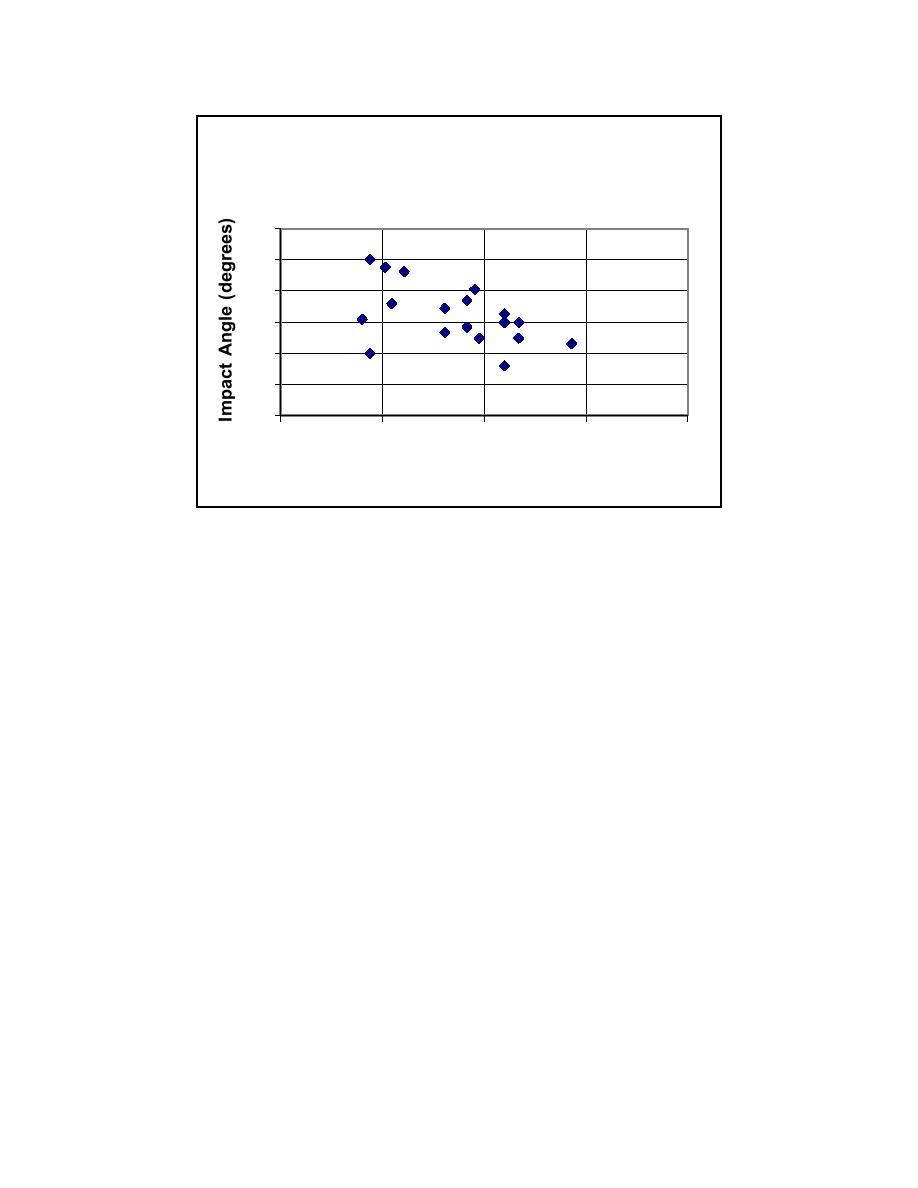
Impact Angle Versus Velocity
Load Beam Experiments
30
25
20
15
10
5
0
0.00
1.00
2.00
3.00
4.00
Velocity (ft/s)
Figure F-2. Impact angle and velocities matrix for load beam experiments
F-4. Full-Scale Crushing Experiments
a. The full-scale crushing experiments were conducted in New Orleans, Louisiana, at the Halter
Gulf Repair facilities during 21-23 June 2000. The experiments consisted of using two jumbo open
hopper 29- by 41-m (95- by 135-ft) barges that were recently removed from service on the inland water-
ways and donated for the experiments. The barges were impacted using the 14-MN Statnamic load device
owned by Applied Foundation Testing of Green Cove Springs, Florida. The Statnamic device is used
primarily to test the axial and lateral capacities of piles and drilled shafts. The Statnamic device used for
the experiments has the capability to deliver up to 10,675 kN (2,400 kips) of lateral force at a time dura-
tion similar to a barge impact. Figure F-3 shows the Statnamic equipment and the experimental setup
during the crushing experiments.
b. A total of nine experiments were conducted on both the barge corners and headlogs (front face of
the barge above the rake) of the two barges to determine the impact forces and deformations of the com-
ponents. The experiments were conducted by incrementally loading the barge first to gain the linear
response of the component and second to get the plastic or nonlinear response of the barge system. The
barges were instrumented with accelerometers, strain gages, and force load cell to capture the impact data.
High-speed and normal-speed video equipment was positioned above the impact zone to document the
deformations and movements of the barge during impact. The impact loads on the barges ranged from
1,779 kN (400 kips) up to 7,117 kN (1,600 kips) of lateral forces. Deformations range from no observable
to a foot of displacement. Figure F-4 shows the crushing damage to the headlog of the barge under a
3,558-kN (800-kip) force applied between rake trusses. Maximum deformation of the headlog in
Figure F-4 is approximately 23 cm (9 in.).
F-3


 Previous Page
