
ETL 1110-2-347
31 May 93
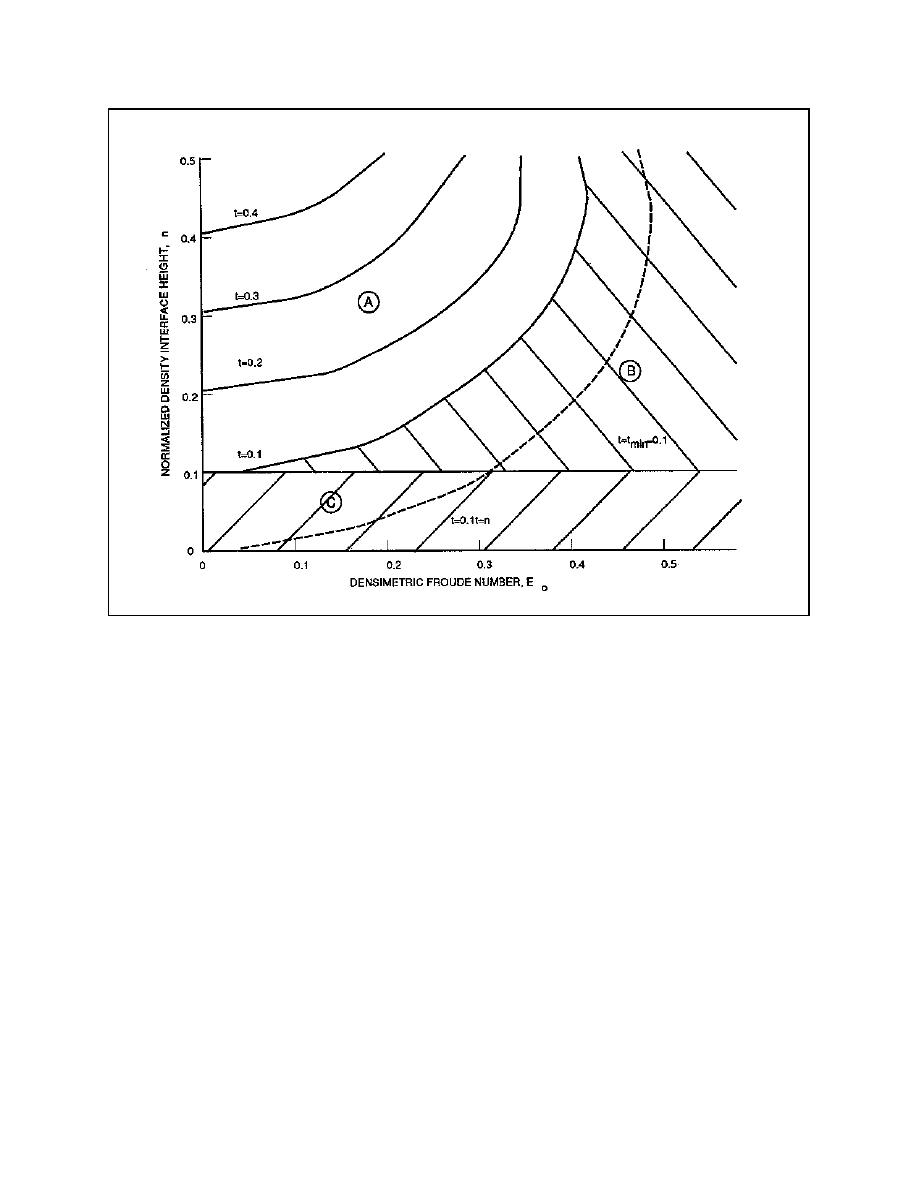
Figure 6. Design diagram for salinity intrusion control devices
EXAMPLE: Consider a river with a discharge of
b. Arita, M., and Jirka, G. H. 1987b. "Two
58,450 cfs and an observed intruding saline wedge
Layer Model of the Saline Wedge. Part II:
with an interface height of 10.5 ft. Taking the river
Entrainment and Interfacial Friction," Journal
width as 1,000 ft, the depth as 35 ft, and the density
Hydraulic Engineering, American Society of Civil
ration, ((ps - pf)/pf), as 0.02, it is estimated that
Engineers, Vol 113, No. 10.
qf = 1.67 cfs/ft, hence the Froude Number, F0 =
0.01 and the normalized density interface n = 0.30.
Using these two values to locate the point on the
and Related Phenomena," Journal Fluid Mechanics,
diagram, the value of t = 0.3 in zone A. The
Vol 31 Part 2, pp 209-248.
design height of the control device, td, is estimated
to be 10.5 ft.
d. Jirka, G. H., and Arita, M. 1987. "Density
Currents or Density Wedges: Boundary Layer
Influence and Control Methods," Journal of Fluid
13. References
Mechanics, Vol 177, pp 187-206.
a. Arita, M., and Jirka, G. H. 1987a. "Two
e. Jirka, G. H., and Sutherland, N. D. "Exper-
Layer Model of the Saline Wedge. Part I: Entrain-
imental Study of Salinity Intrusion Control Methods
ment and Interfacial Friction," Journal Hydraulic
in Estuaries and Waterways, Contract Technical
Engineering, American Society of Civil Engineers,
Report" (in preparation), U.S. Army Engineer
Vol 113, No. 10.
Waterways Experiment Station, Vicksburg, MS.
1-6

 Previous Page
