ETL 1110-2-367
31 Mar 95
b.
Rainfall data. Historical rainfall records were
c.
Delineation of interior areas.
assembled for continuous simulation analysis (CSA) and
hypothetical depth-duration-frequency relationships were
(1)
Interior areas were delineated based on alignment
developed for hypothetical event analysis (HEA).
of the line-of-protection, minimum facility requirements, runoff
topology, topography of local ponding areas, and present and
(1)
Historical rainfall records of nearby recording rain
potential future storm sewer and water collector/conveyance
gauges were used to develop a continuous period-of-record
systems.
rainfall record for Napa River interior areas. Recorded hourly
incremental rainfall data were adjusted by the ratio of mean
(2)
Interior Area 5 is located on the right bank of Napa
annual precipitation at the gauges to that for Napa River interior
River just upstream from the mouth of Napa Creek (see Figure
areas. A composite precipitation record for water year (WY)
D-4). This 1.5-sq-mile area is bounded by the Napa River on
1949 through WY 1989 was determined in this manner for use
the east, Highway 29 on the west, approximately Trancas Street
in CSA. The computed composite record was written to HEC-
on the north, and Napa Creek on the south. The area was
DSS and then imported into HEC-IFH. After importing the
divided into an upper and lower portion to accommodate the
composite record, incremental rainfall can be plotted on a
previously developed HEC-1 basin model. Runoff parameters
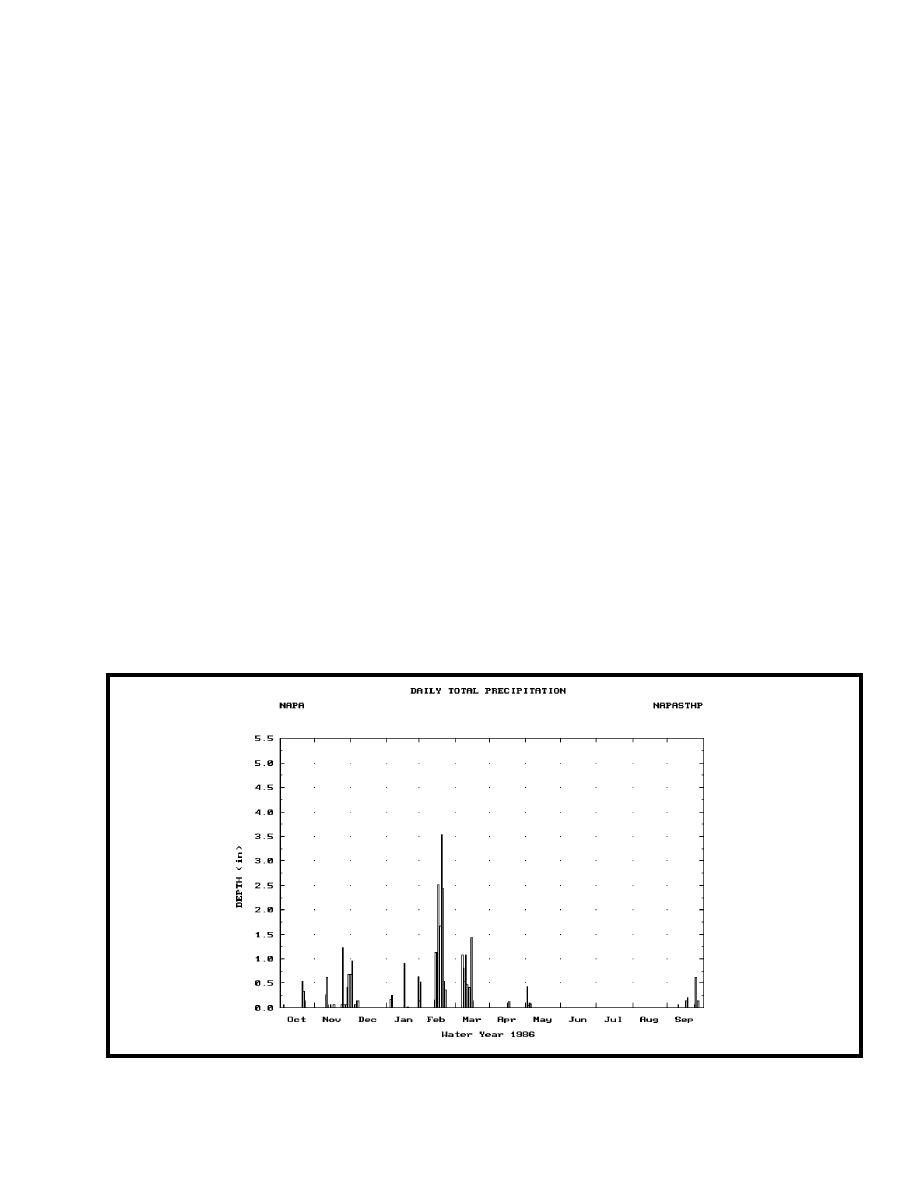
yearly, monthly, or daily basis. Figure D-2 shows daily total
and the existing storm sewer layout are described in subsequent
daily precipitation for WY 1986.
sections.
d.
Runoff characteristics.
(2)
Hypothetical frequency storm depth-duration-
frequency relationships for general rain and local storms were
developed from rainfall frequency data that were available for
(1)
The Sacramento District developed a HEC-1
the Martinez 3S and Napa State Hospital gauges. Depths were
rainfall-runoff model for simulating historical flood events for
adjusted by ratios of the mean annual precipitation (MAP) for
Napa River interior areas during previous studies. The HEC-1
the gauges and the MAP for the Napa River interior area
model used the kinematic wave technique for transforming
estimated from a MAP isohyetal map. The adopted depth-
rainfall to runoff. HEC-IFH does not use kinematic wave and
duration-frequency rainfall relationships for a general rain storm
therefore it was not possible to reproduce the modeling effort in
are shown in Figure D-3. The development of precipitation data
HEC-IFH. It was important to preserve the timing of the
for computing exterior period-of-record discharge hydrographs
interior runoff and the detail of the HEC-1 model because
is described in paragraph D-4f.
interior areas were divided into many subareas and reaches to
Figure D-2. Interior area composite historical precipitation data
D-3


 Previous Page
