ETL 1110-2-365
31 Aug 94
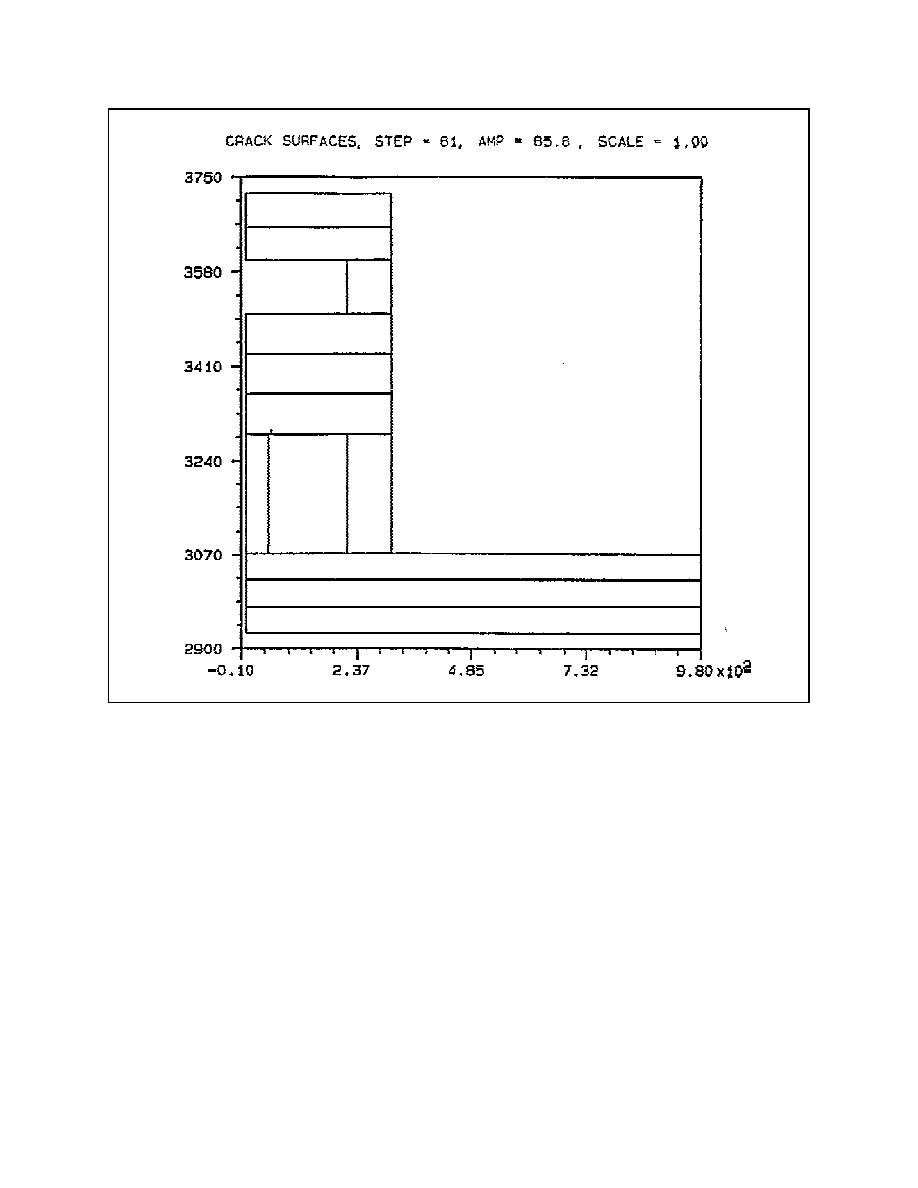
Figure B-3.
Crack plot at day 85.75 of the middle wall half of the chamber monolith model
B-4. Placing Temperature Parametric Study
particularly in the slab as seen in Figure B-16
(day 143) where a potential of 96 percent occurs.
Figure B-17 is a plot at day 163 after the initial
a. General. One of the parametric studies per-
cracking in this portion of the slab has occurred. The
formed during the course of the Olmsted project's
location of the crack is obvious from the reduced area
NISA study was an evaluation of concrete placing
of potential. Also, the point where the next integra-
temperatures. It is a regular practice in mass concrete
tion point will crack can be seen in the figure by the
construction to reduce the temperature of the concrete
designation of the 98 percent cracking potential. The
when it is placed as a means of reducing the maxi-
potentials after all of the cracking has occurred are
mum temperature that the concrete will reach since
shown in Figure B-18 and are similar to what was
lowering the maximum temperature can reduce ther-
observed in the left half of the model.
mal stresses in the concrete. The initial assumption
B-5


 Previous Page
