ETL 1110-2-365
31 Aug 94
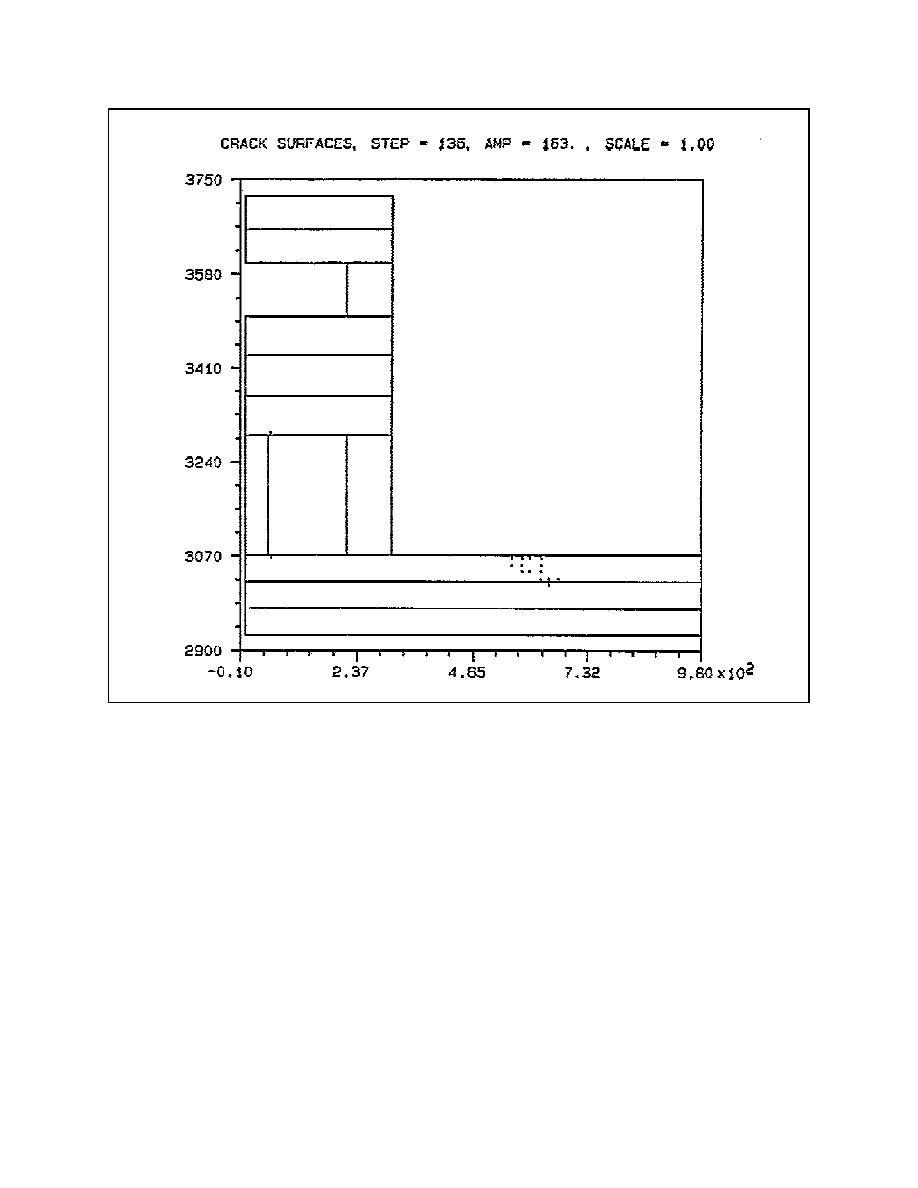
Figure B-5.
Crack plot at day 163 of the middle wall half of the chamber monolith model
would create the worse condition, but Figure B-22
(designated in the plots by "Extreme Ambient"), node
3371 near the top of the slab follows the ambient
shows that this is not the case in this instance. The
maximum stress for the 60 oF placing temperature
much more closely than the other two curves. If the
plots from the three figures were superimposed upon
case is approximately 80 psi higher than the maxi-
one another, a substantial temperature gradient would
mum stress at this point for the ambient placing
occur from the top to the bottom of the slab at
temperature case. While these results do not match
approximately day 200.
conventional understanding from analysis of mass
concrete structures, there is a logical explanation.
(2) Stress results. Plots of stress used in evaluat-
The results shown in Figure B-22 are essentially a
ing the results are shown Figures B-22 through B-26.
surface effect as shown in the stress distribution plot
Figure B-22 is a time-history plot of the horizontal
in Figure B-23. Surface effects cause the stress to be
stress at the point of maximum stress in the chamber
lower for the ambient placing temperature, but at
monolith. As mentioned previously, in the past it has
other points through the slab thickness this is not
been assumed that a higher placing temperature
necessarily the case. A time history at the second
B-7


 Previous Page
