ETL 1110-2-367
31 Mar 95
5
4
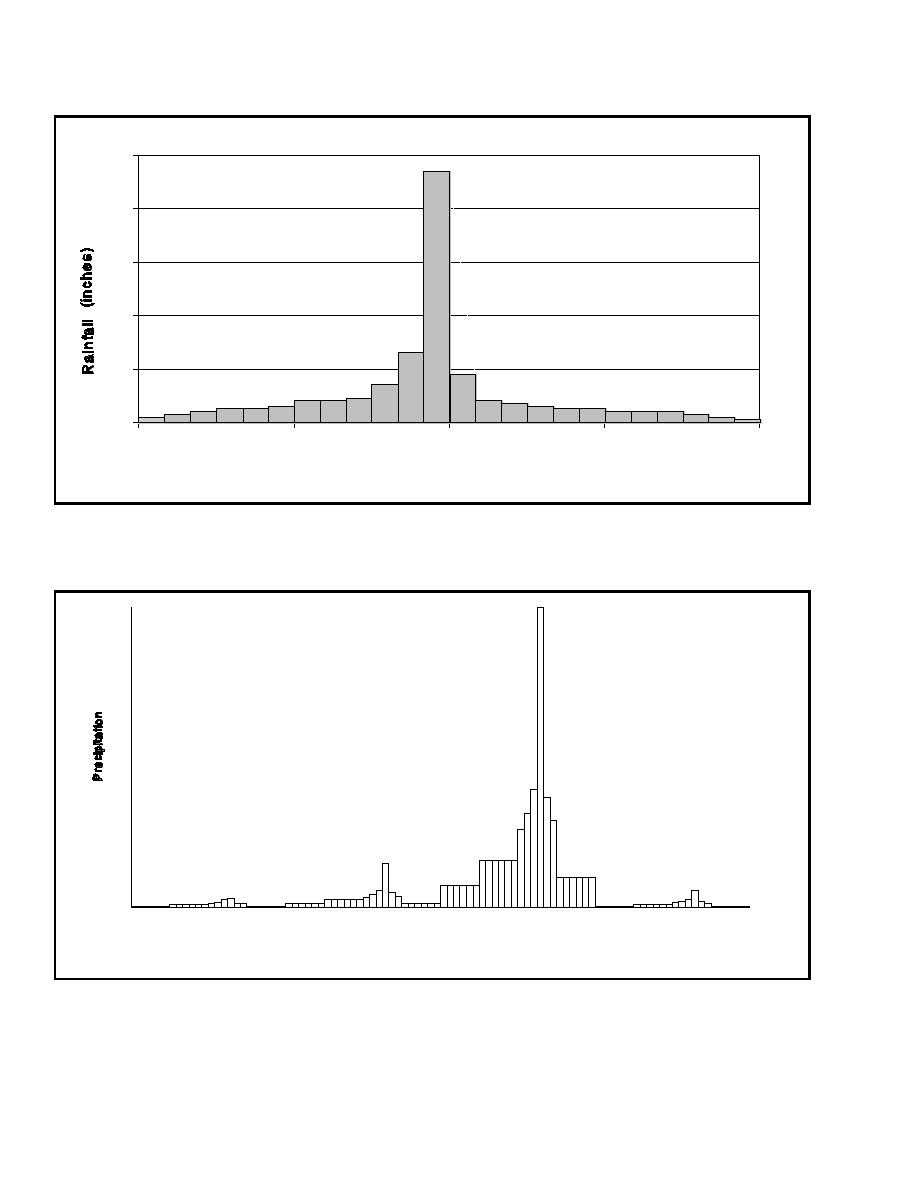
2-Year Return Period
3
24-Hour Duration
2
1-Hour Interval
1
0
0
6
12
18
24
Time (hours)
Figure 3-9. Hypothetical frequency storm hyetograph
0
24
48
72
96
Time (Hours)
Figure 3-10. Typical SPS precipitation distribution
3-8


 Previous Page
