
ETL 1110-2-544
31 Jul 95
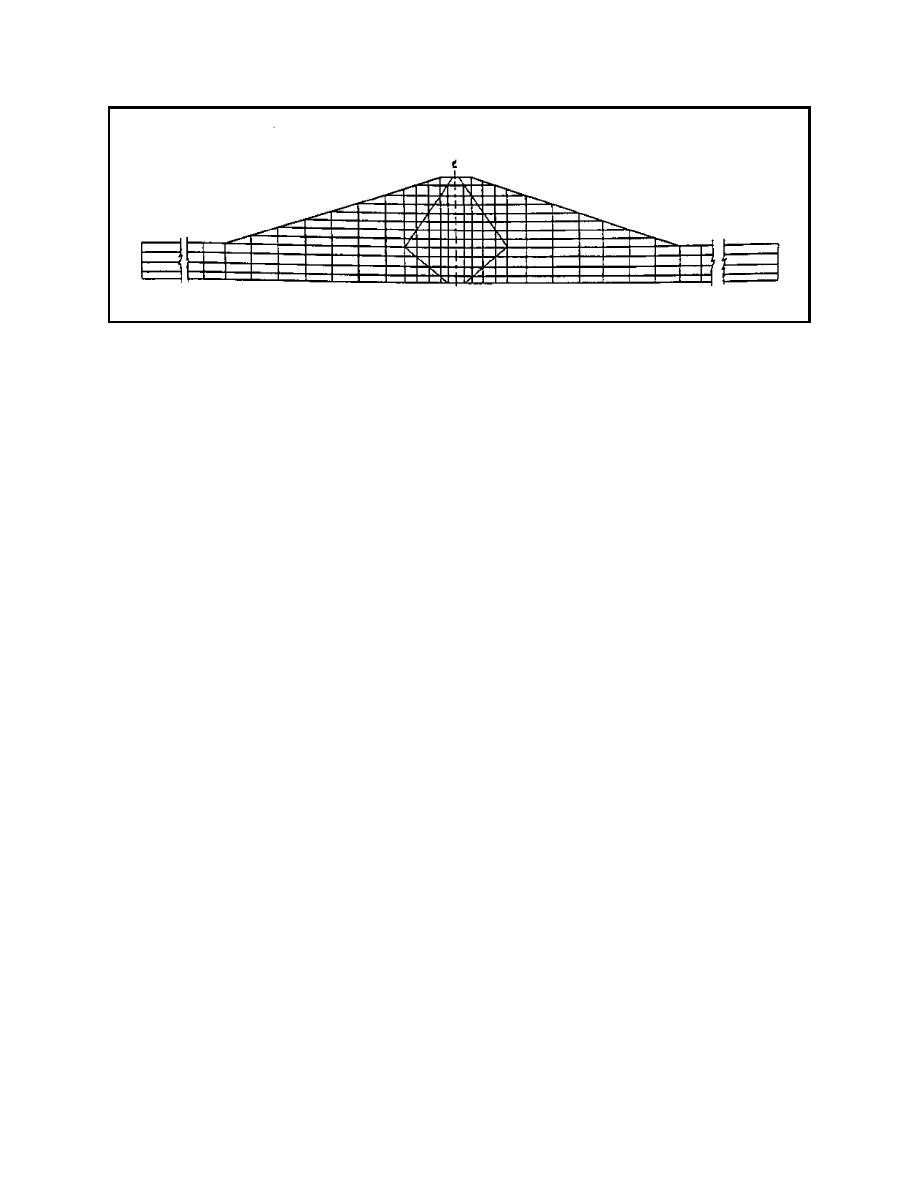
Figure 17. Finite element mesh of Birch Dam
and undrained analyses proceeded according to this
passes through the zone of foundation materials where
schedule. Level ground conditions were presumed to
100 percent of the available shear strength is mo-
exist just prior to the start of Stage I. The core trench
bilized. Similar results are shown in Figure 21 for the
was presumed to be in place at this time as excavation
drained case where the limit equilibrium analysis
and filling of the core trench were not modeled. As
showed the safety factor to be 2.33. The estimated
shown in Figure 18, Stage I was modeled in five load
horizontal and vertical movements in the embankment
steps by placement of the bottom five rows of elements
and foundation with consolidation taken into account
and Stage II was modeled in three load steps by the top
are shown in Figures 22 and 23 at the indicated times.
three rows of the embankment. Movements and
These results are presented in a form consistent with
stresses in the embankment and foundation were
that of data to be collected from instrumentation.
desired at the following times from the output:
(1) Start of construction, t = 0 months.
3-4. Case History: New Melones Dam
(2) End of Stage I, t = 4 months.
a. Project description. A second example of a
finite element analysis of the construction and
(3) End of the waiting period between Stages I
performance of an embankment dam was reported by
and II, t = 13.5 months.
Chang and Duncan (1977) for New Melones Dam.
New Melones Dam was constructed by the U.S. Army
(4) End of Stage II, t = 16.5 months.
Engineer District, Sacramento, on the Stanislaus River
to create a multipurpose reservoir capable of
(5) After construction had been completed for
impounding 2.4 million acre-ft of water. The dam,
13.5 months, t = 30 months.
built in a canyon, has a maximum height of 625 ft
above the streambed and a length of 1,600 ft. Plan and
(6) After reservoir filling.
cross-sectional views of New Melones Dam are shown
in Figures 24 and 25.
f. Results. A vector plot showing the
displacements at various times with consideration of the
b. Purpose. The purpose of the analysis was to
effects of consolidation is shown in Figure 19. The
provide insight into three important questions related to
percentage of the available shear strength mobilized
the consolidation of the core and behavior of zoned
in the cross section for the undrained and drained
embankment dams. The questions were:
cases is shown in Figures 20 and 21, respectively. Al-
so shown in these figures is the safety factor of the
(1) What is the nature of expected movements in
critical circles from a conventional limit equilibrium
a zoned dam during the consolidation of the core?
analyses. Figure 20 shows that the results for the
undrained finite element method analysis agree with
(2) How do the stresses in the embankment
those from the slope stability analysis. In these
change during consolidation?
analyses, the critical circle (whose factor of safety
equals 1.25)
A-18

 Previous Page
