ETL 1110-2-550
30 May 97
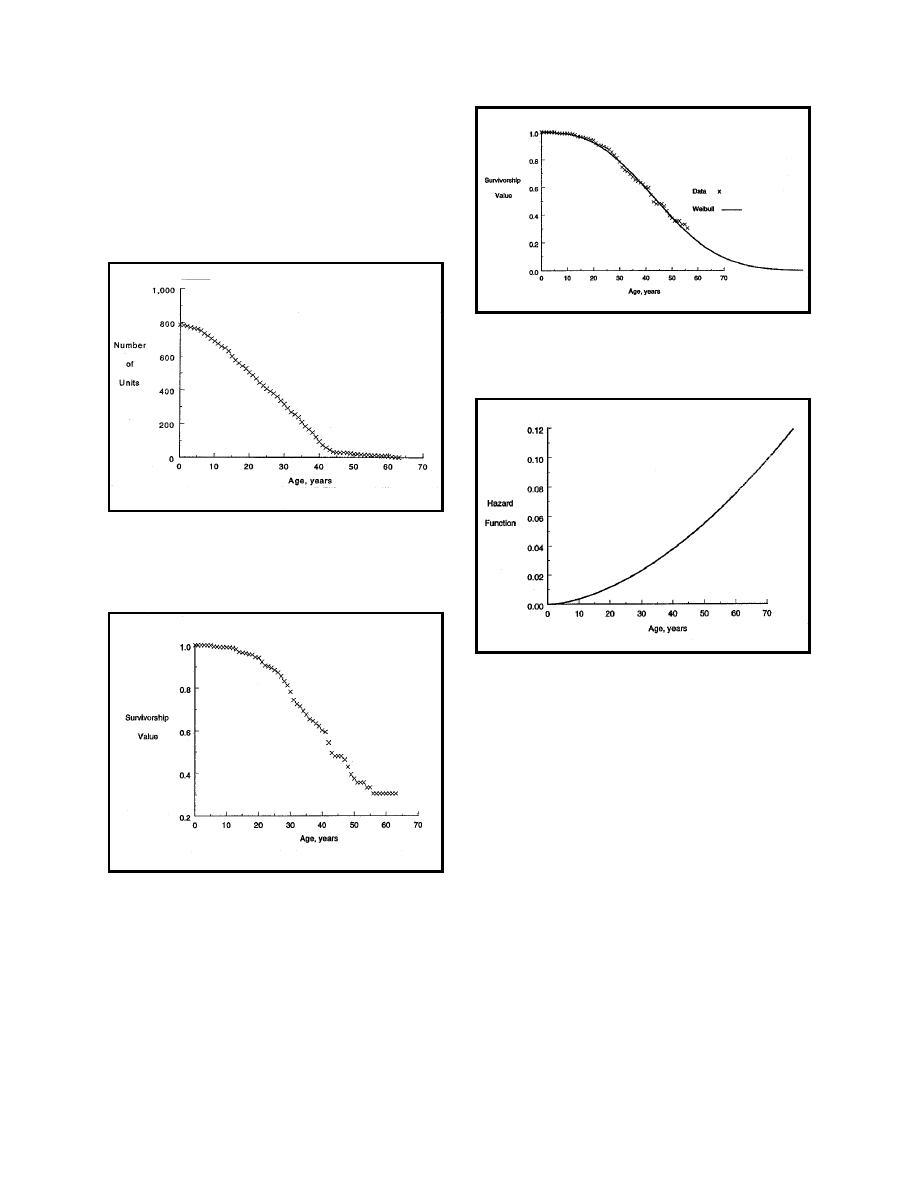
e. Figure 1 is a plot of generator raw data
showing the number of units performing
satisfactorily given years in service or age. Figure 2
shows these data plotted as a reliability curve, with
percent in service as the ordinate. Figures 3 and 4
then show these data fitted to a Weibull curve and
the resultant hazard function, respectively.
Figure 3. Generator stator windings. Weibull
distribution
Figure 1. Generator stator windings. Number of
units performing satisfactorily versus years in
service
Figure 4. Generator stator windings. Hazard
function from Weibull distribution
a screening tool which provides a uniform method
of evaluating condition through testing and inspec-
tions. Inspection and test data are gathered and
condition index numbers assigned for each unit in
accordance with the latest guidance. Equipment
with CI values from 70 to 100 is considered to be in
very good to excellent condition. CI values in this
range, when applied to the survivor curve, will tend
to show increased reliability. Equipment with CI
Figure 2. Generator stator windings. Reliability
curve
values in the midrange, from 40 to 69, is considered
f. The factor being used by the Corps to
fair to good. The best prediction of this
evaluate equipment condition and modify the
equipment's reliability is the statistical baseline
frequency curve data is the condition indicator (CI).
data of similar equipment. Therefore, there is no
Condition indicator evaluation methods have been
cause to adjust the baseline frequency curve for
developed by the Corps for many types of
equipment that falls into this category. Equipment
equipment and structures (USACE 1993). CI's are
with a CI below 40 is considered to be in poor
condition or worse. CI values below 40 will tend to
6


 Previous Page
