
ETL 1110-2-560
30 Jun 01
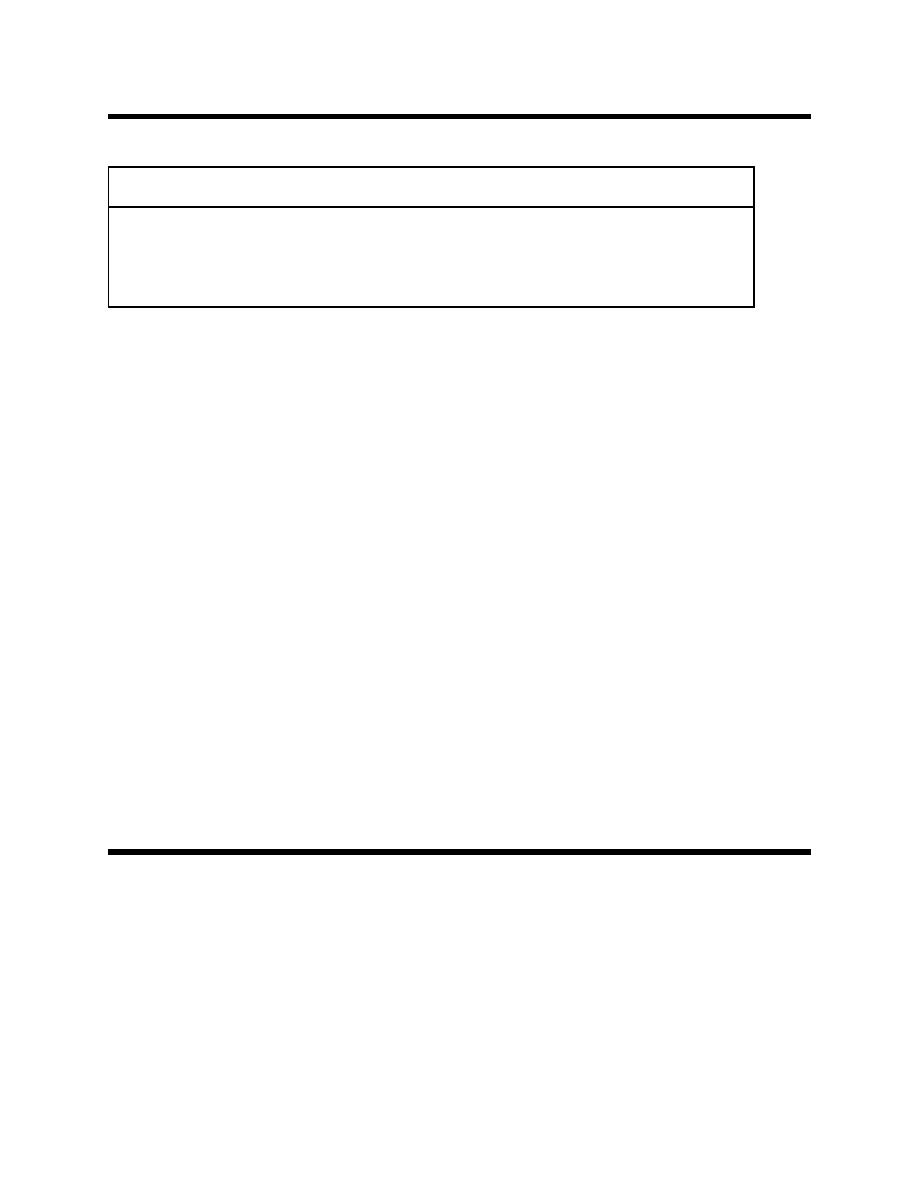
Table D-7
Reliability Analysis, Dam Gate Machinery
Charac.
Component/Block
Quan.
Failure Failure
Weibull
Environmental
Life
Duty
Shape Factor, β
α/MTTF
α,
Rate*
Mode
K Factor
Yrs Factor, d
10
1.4054 misalignment
1.0
1.00
2
40.6131
0.007
Ball Bearing
4
1.6445 wear
1.0
1.00
2
34.7082
0.007
Brake
1
2.1000 jamming/misalign.
1.0
1.00
2
27.1798
0.007
Worm Gear Box
1
5.0000 wear
3.0
1.10
2
12.5571
0.007
Plain Bronze Bearings
16
2.8201 wear
3.0
1.10
2
22.2635
0.007
Spur Gearset
6
3.2232 wear
3.0
1.10
2
19.4792
0.007
Shafts
4
0.9298 fracture
1.0
1.00
2
61.3870
0.007
Information not Available
Sprocket
2
RELIABILITY [R(t)] OF INDIVIDUAL COMPONENTS
Years in Service (Equipment is installed at time 0)
0
5
10
15
20
25
30
35
40
45
50
63
Year
1937
1942
1947
1952
1957
1962
1967
1972
1977
1982
1987
2000
1.0000
0.9991
0.9983
0.9974
0.9966
0.9957
0.9948
0.9940
0.9931
0.9923
0.9914
0.9892
Ball Bearing
1.0000
0.9990
0.9980
0.9970
0.9960
0.9950
0.9940
0.9930
0.9920
0.9910
0.9900
0.9874
Brake
1.0000
0.9987
0.9974
0.9961
0.9949
0.9936
0.9923
0.9910
0.9898
0.9885
0.9872
0.9839
Worm Gear Reducer
1.0000
1.0000
1.0000
1.0000
1.0000
1.0000
1.0000
1.0000
1.0000
1.0000
1.0000
1.0000
Spur Gearset
1.0000
1.0000
1.0000
1.0000
1.0000
1.0000
1.0000
1.0000
1.0000
1.0000
1.0000
1.0000
Plain Bronze Bearings
1.0000
1.0000
1.0000
1.0000
1.0000
1.0000
1.0000
1.0000
1.0000
1.0000
1.0000
1.0000
Shafts
1.0000
0.9994
0.9989
0.9983
0.9977
0.9972
0.9966
0.9960
0.9954
0.9949
0.9943
0.9928
HAZARD RATES [h(t)] OF INDIVIDUAL COMPONENTS
Year
1937
1942
1947
1952
1957
1962
1967
1972
1977
1982
1987
2000
0.0246
0.0246
0.0246
0.0246
0.0246
0.0246
0.0246
0.0246
0.0246
0.0246
0.0246
0.0246
Ball Bearing
0.0288
0.0288
0.0288
0.0288
0.0288
0.0288
0.0288
0.0288
0.0288
0.0288
0.0288
0.0288
Brake
0.0368
0.0368
0.0368
0.0368
0.0368
0.0368
0.0368
0.0368
0.0368
0.0368
0.0368
0.0368
Worm Gear Reducer
0.0000
0.0000
0.0000
0.0000
0.0000
0.0000
0.0001
0.0001
0.0001
0.0002
0.0002
0.0003
Spur Gearset
0.0000
0.0000
0.0000
0.0000
0.0000
0.0000
0.0000
0.0000
0.0000
0.0000
0.0000
0.0001
Plain Bronze Bearings
0.0000
0.0000
0.0000
0.0000
0.0000
0.0000
0.0000
0.0000
0.0000
0.0000
0.0000
0.0001
Shafts
0.0163
0.0163
0.0163
0.0163
0.0163
0.0163
0.0163
0.0163
0.0163
0.0163
0.0163
0.0163
RELIABILITY OF SYSTEM
[R (t)]
sys
Year
1937
1942
1947
1952
1957
1962
1967
1972
1977
1982
1987
2000
1.0000
0.9839
0.9681
0.9525
0.9372
0.9221
0.9072
0.8926
0.8782
0.8641
0.8502
0.8149
6
* Failure Rate per 10 Operating Hours from Reliability Analysis Center (1995)
D-11

 Previous Page
