ETL 1110-2-560
30 Jun 01
E-2. Reliability Block Diagram Formulation
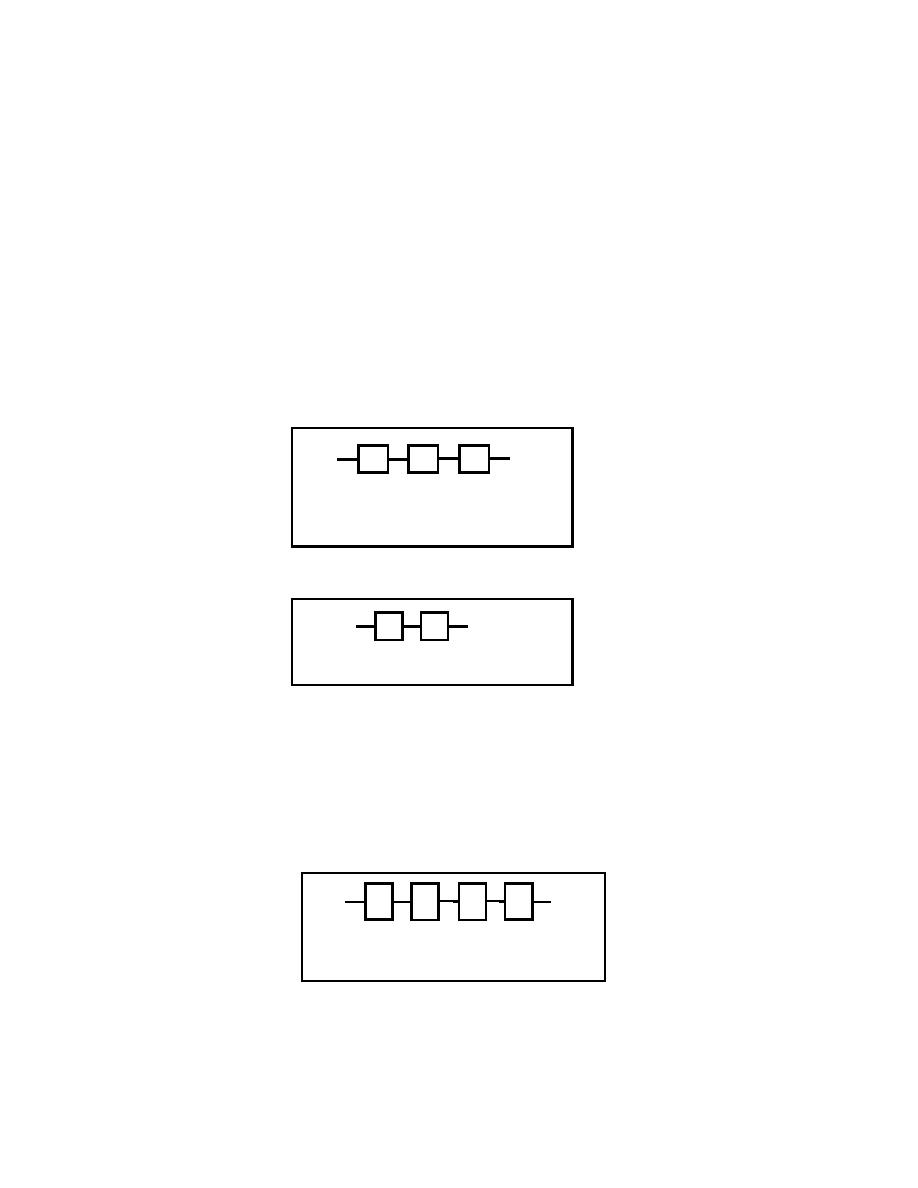
a. The normal electrical service (LAl) was arranged into a series connected block diagram that
included the utility power supply, underground cables in duct, and a main circuit breaker as shown in
Figure E-2. The resulting equation is
RSYS(t) = RA(t)*RB(t)*RC(t)
(E-1)
and underground cables in duct as shown in Figure E-3. The resulting equation is
RSYS(t) = RD(t)*RB(t)
(E-2)
c. The automatic transfer switch (LB) and switchboard (LC) did not require additional refinement in
the diagram because the reliability information for these items was readily available directly in published
sources (Reliability Analysis Center 1995).
A
B
C
A - Utility Power Supply
B - Underground cables in duct
C - Main Circuit Breaker
Figure E-2. Electrical service (LA1) block diagram
D
B
D - Standby Generator
Figure E-3. Standby service (LA2) block diagram
d. The dam feeders and each of the lock gates and valves obtain their power from the switchboard
located in the central control station. The two feeder blocks (DD1 and DD2) were connected in parallel
to designate the redundancy of this subsystem. Each feeder was diagrammed as a series of blocks
representing a molded case circuit breaker, underground cables in duct, another molded case circuit
breaker, and aboveground cables in conduit, respectively, as shown in Figure E-4. The resulting
equation is
E
B
E
F
E - Circuit Breaker
F - Aboveground cables in conduit
Figure E-4. Dam feeder (DD1 and DD2) block diagram
RSYS(t) = RE(t)*RB(t)*RE(t)*RF(t)
(E-3)
E-2


 Previous Page
