
ETL 1110-2-563
30 Sep 04
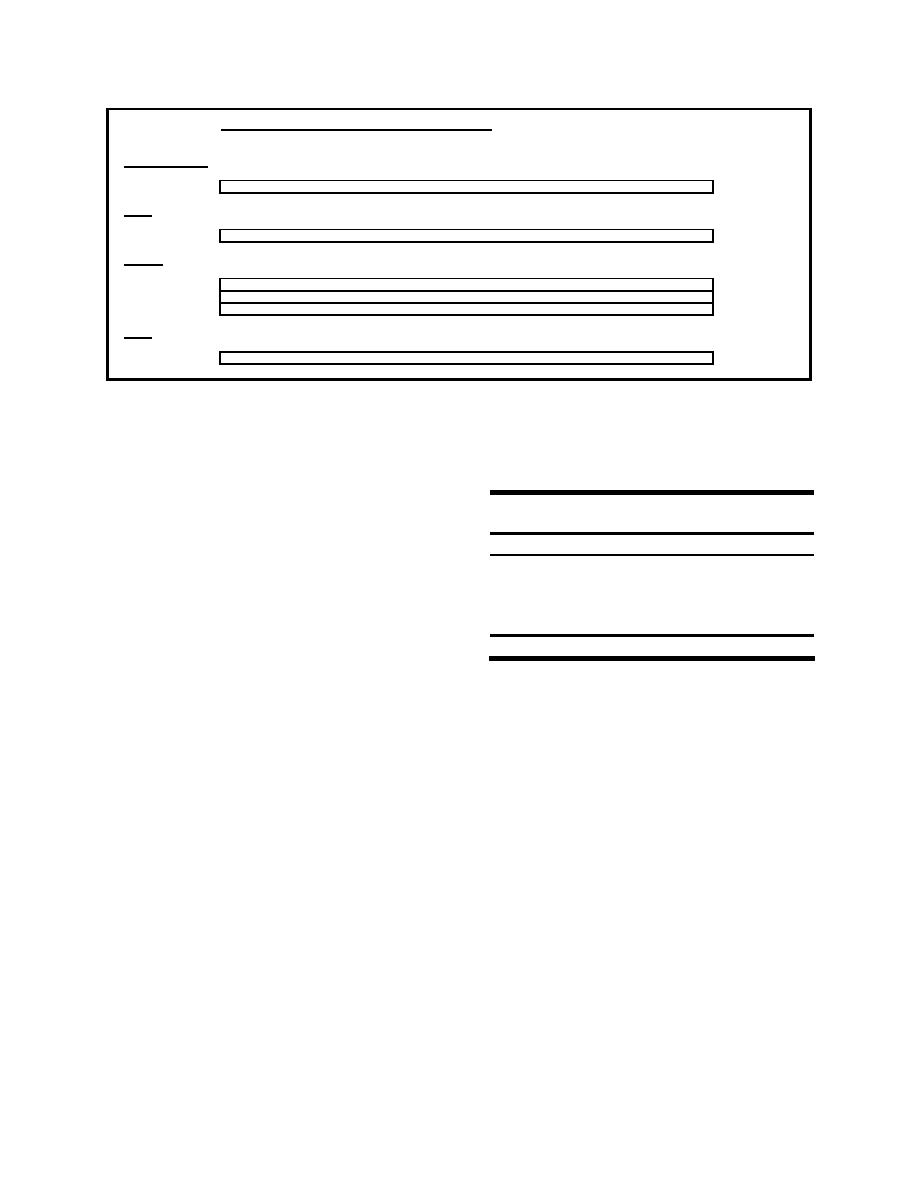
Olmsted PBIA Example Using Empirical Method
Mass Distribution
=RiskDiscrete(Mass!A33:A65,Mass!B33:B65)
short tons
Angle
=RiskLognorm(3.86,1.31)
degrees
Velocity
Vox
=RiskLognorm(1.44,5.5,RiskTruncate(0,6))
feet per second
Voy
=RiskLognorm(0.048,0.083,RiskTruncate(0,1))
feet per second
Vn
=(B14*SIN($B*PI()/180)+B15*COS($B*PI()/180))
feet per second
Force
Fm
=RiskOutput("Impact Force") + 0.435*($B*2/32.2)*(B14*SIN($B*PI()/180)+B15*COS($B*PI()/180))
kips
Figure D-8. Excel and @Risk spreadsheet cell formulas
d. PBIA results.
(1) The statistical results from the PBIA are
Table D-4
shown in Table D-4. This table shows the minimum,
Statistics from PBIA Example
maximum, mean, and standard deviation from the
Statistic
Force, kips
simulation data for the impact force. However, since
Minimum
0.05
the PBIA is performed to calculate the return periods,
Maximum
978.89
the output needs to be expressed in terms of either the
Mean
47.21
histogram, cumulative probability distribution, or the
corresponding percentiles of the impact loads. These
Std Dev
67.52
are all derived from the output or graphing capabilities
Note: To convert force to kilonewtons, multiply by 4.448.
from with the @Risk simulation program.
(2) The histogram shows the range and distribution of expected annual impact forces. Figure D-9
shows the histogram for this example. The histogram shows that a majority of the impact forces (over
90 percent as shown in Figure D-9) from the simulation are below the mean value of 209.95 kN
(47.2 kips). From this histogram, a cumulative probability distribution of impact forces can be fit. Figure
D-10 shows the cumulative probability distribution for the PBIA. The cumulative probability distribution
is used to determine the percentage of distribution that is below a specified level. Figure D-10 shows that
90 percent of impact values below the mean value and 10 percent of the distribution lie above that value.
(3) For a PBIA, the simplest way to determine the return period is to use percentiles for the distribu-
tion of annual impact forces. Percentiles are defined as the percentage of annual impact force that occurs
at or below that impact force. The resulting percentiles can be used to determine the Probability of
Exceedence P(E), which is the converse of the percentile such that both should add up to unity. The return
period RT can be determined by using the equation
RT = 1/(1-Percentile (in decimal))
= 1/P(E)
The values for this PBIA example are shown in Table D-5.
D-8

 Previous Page
