ETL 1110-2-563
30 Sep 04
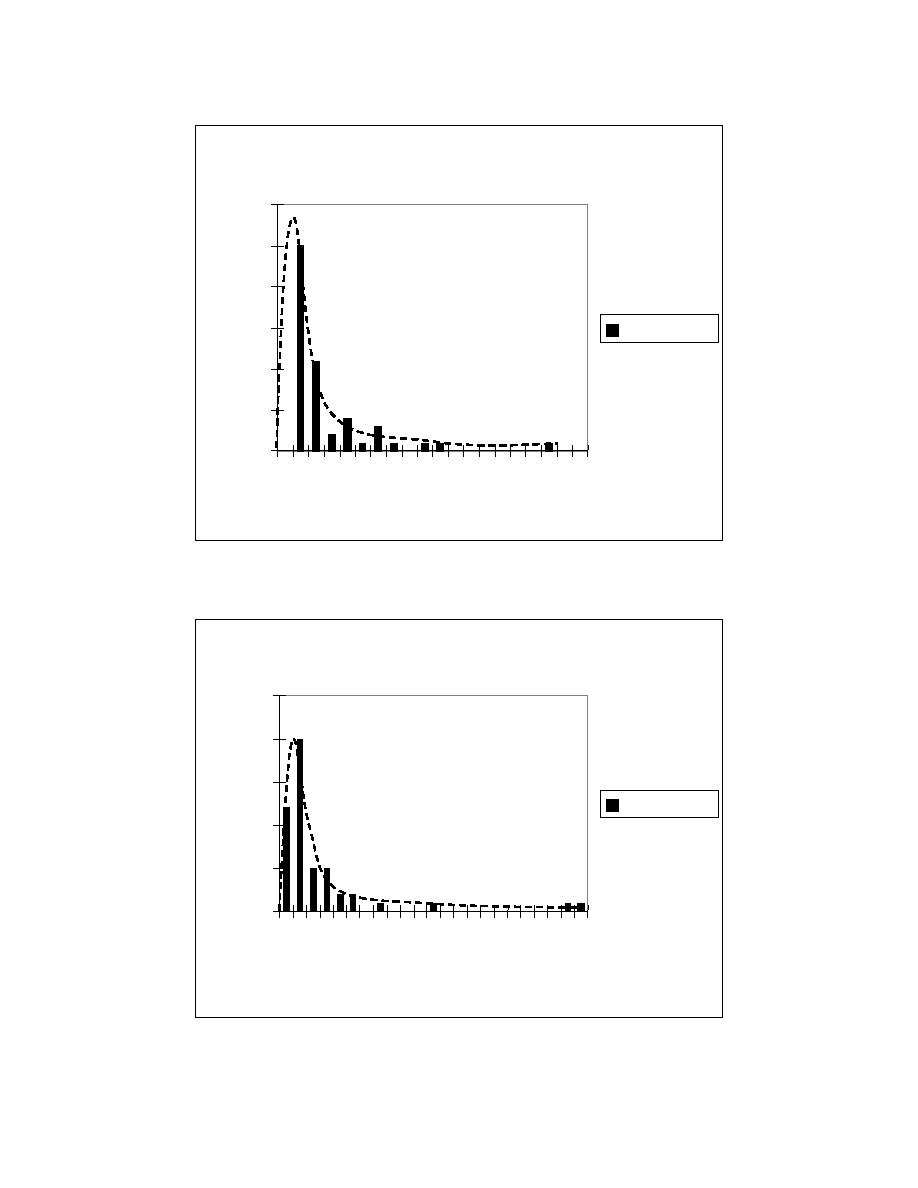
Fitted Distribution for Vox
Lognormal (1.44, 5.5)
30
25
20
15
10
5
0
0
1
2
3
4
5
6
7
8
9
Vox (ft/sec)
Figure D-5. Histogram of longitudinal velocity from experiments (note: lognormal
distribution is fitted dashed line)
Fitted Distribution for Voy
Lognormal (0.048, 0.083)
25
20
15
10
5
0
0.01 0.07 0.13 0.19 0.25 0.31 0.37 0.43
Voy (ft/sec)
Figure D-6. Histogram of transverse velocity from experiments (note: lognormal
distribution is fitted dashed line)
D-6


 Previous Page
