ETL 1110-1-175
30 Jun 97
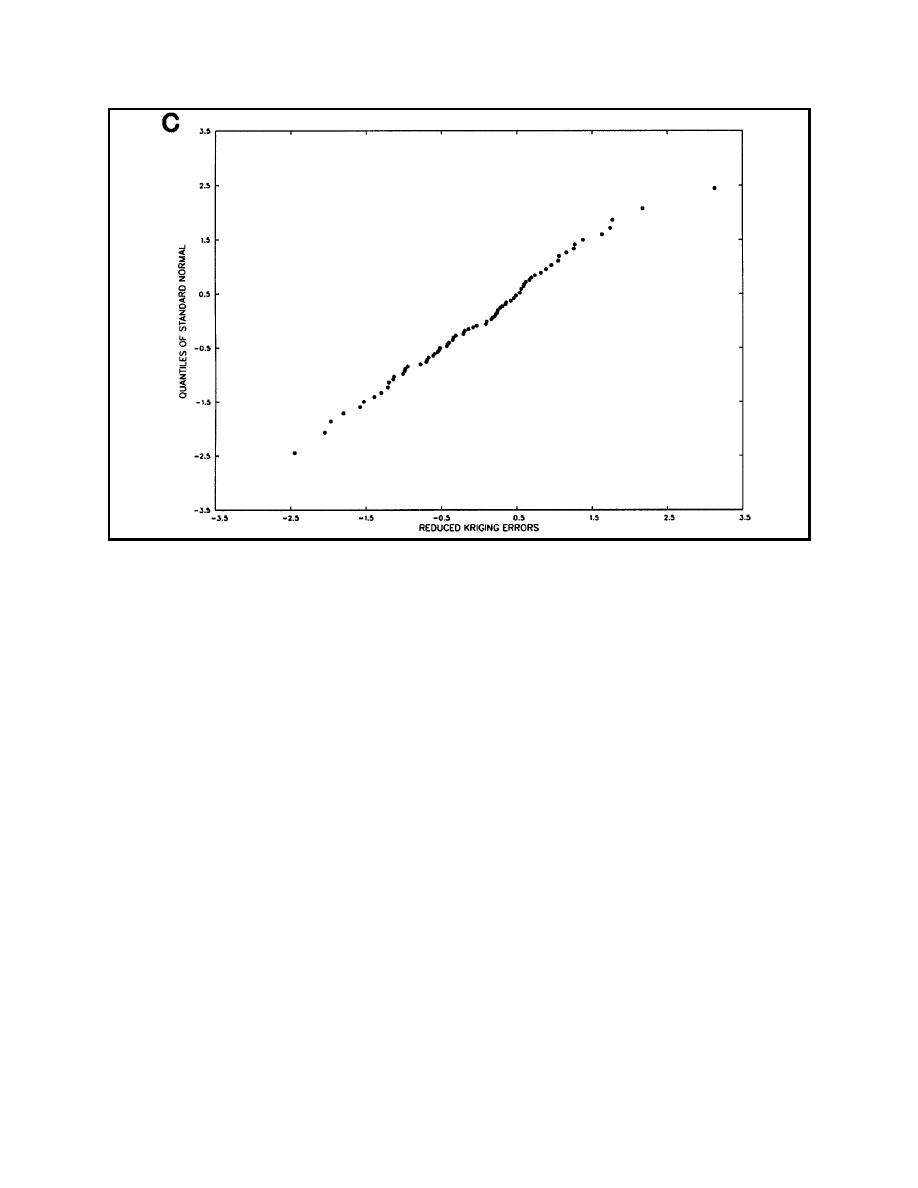
Figure 5-2. (Sheet 3 of 3)
inevitable because the determination of just where
(3) Cross-validation was performed, and the
bedrock begins is complicated and subjective.
results, (Table 5-1, bedrock A), were not
acceptable.
b. The set of measured locations, set A, is
c. The cross-validation exercise produced a
shown in Figure 5-4a and the basic univariate sta-
tistics are listed in Table 4-1 (bedrock A); modifi-
reduced-root-mean-squared error of 2.146
cations to the measured data, in the form of
[Table 5-1 (bedrock A)] which indicates, as
removal of sites is shown in Figure 5-4b. The
described in Chapter 4, that the kriging variance is
techniques described in section 4-1 were used to
underestimated to an unsatisfactory degree. Fur-
guide the following steps for variogram
ther attempts to fit the Gaussian model to the
construction:
sample variogram points produced better cross-
validation statistics; however, the Gaussian curve
(1) The raw variogram indicated a stationary
began to depart substantially from the sample
spatial mean. The data were assumed to be suit-
variogram points at the lower lag sample points.
able for ordinary kriging.
As a result, the distribution of the residuals was
explored, and the eastern, and especially north-
(2) An isotropic Gaussian model was used to
eastern, parts were determined to contain prob-
fit the variogram which had a nugget of 0.650 m2,
lematic data values that rendered the distribution
a sill of 12.54 m2, and a range of 914 m
nonhomogeneous. The nonhomogeneous nature is
(Table 5-1, bedrock A).
related to an incised channel present on the
5-7


 Previous Page
