ETL 1110-1-175
30 Jun 97
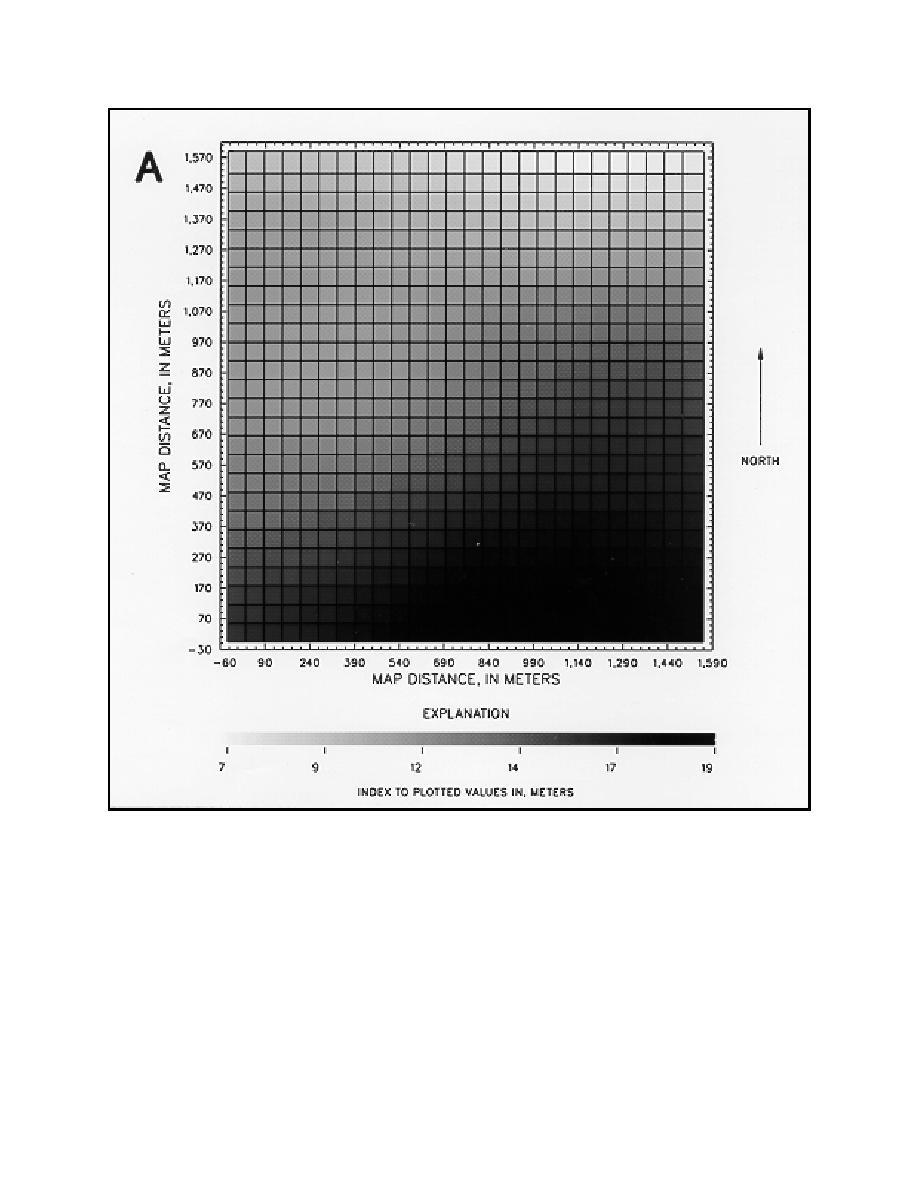
Figure 5-3. Kriging results for water-level examples--A, kriging estimates for original data; B, kriging standard
deviations for original data; C, ratio (original data to original with dropped sites) of kringing standard
deviations; D, kriging standard deviations for original data with added sites (Sheet 1 of 4)
d. The first alternative considered was to fit a
bedrock surface. At this juncture, the measured
data were restricted to exclude the outlying mea-
contrived and nongradual surface to the measured
surements. Before this decision was made, two
data and remove the outlier effect. A splined sur-
alternative methods for dealing with the outlying
face could be capable of producing the desired
values were considered and deemed beyond the
result. The decision whether or not to pursue such
scope of this effort. However, a brief discussion of
a remedy becomes somewhat philosophical. In a
the situation is appropriate.
relatively simple example, as in this bedrock
5-9


 Previous Page
