ETL 1110-2-547
30 Sep 95
variable in an analysis can be modeled as a
random variable as most properties and
parameters have some inherent variability and
f(c)
f( φ )
uncertainty. However, a few specific random
variables will usually dominate the analysis.
Including additional random variables may
φ
c
unnecessarily increase computational effort
without significantly improving results. When
in doubt, a few analyses with and without
certain random variables will quickly illustrate
βσlnFS
E[lnFS]
which are significant, as will the examination
of variance terms in a Taylor's series analysis.
f(lnFS)
For levee analysis, significant random
variables typically include material strengths,
soil permeability or permeability ratio, and
thickness of top stratum. Material properties
such as soil density may be significant, but
where strength and density both appear in an
ln(FS)
analysis, strength may dominate. An example
of a variable that can be represented
deterministically (nonrandom) is the density of
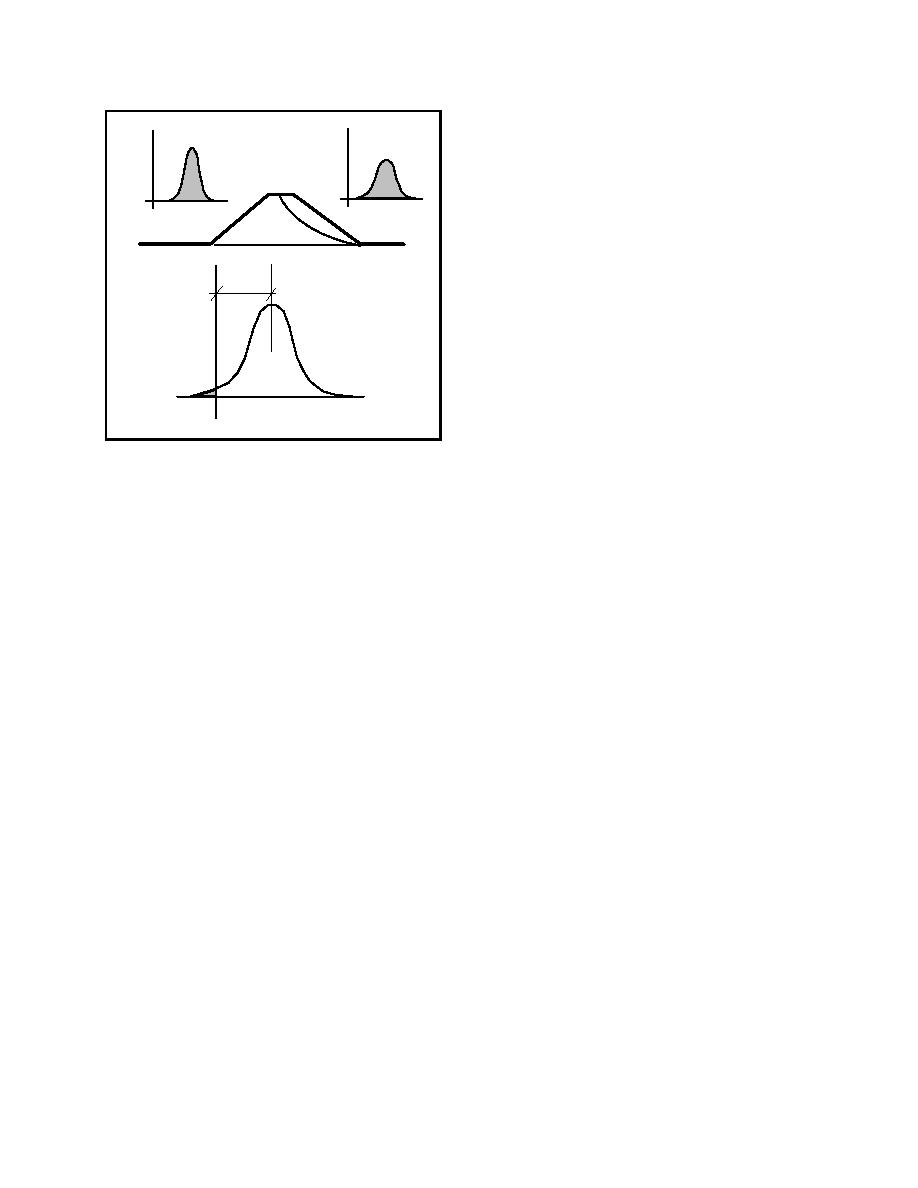
Figure B-1. The capacity-demand model
water.
the factor of safety, and the limit state is taken as the
A performance function and limit state are
condition ln (FS) = 0. The probability of failure is
identified.
then the shaded area corresponding to the condition ln
(FS) < 0. If it is assumed that the distribution on ln
The expected value and standard deviation of
the performance function are calculated. In
obtained using standard statistical tables.
concept, this involves integrating the perfor-
mance function over the probability density
functions of the random variables. In prac-
c. Equivalent performance functions and limit
tice, approximate values are obtained using
states can be defined using other measures, such as the
the expected value, standard deviation, and
exit gradient for seepage.
correlation coefficients of the random vari-
ables in the Taylor's series method or the
d. The probability of failure associated with the
point estimate method.
reliability index is a probability per structure; it has no
The reliability index $ is calculated from the
time-frequency basis. Once a structure is constructed
or loaded as modeled, it either performs satisfactorily
expected and standard deviation of the perfor-
or not. Nevertheless, the $ value calculated for an
mance function. The reliability index is a
existing structure provides a rational comparative
measure of the distance between the expected
measure.
value of ln (C/D) or ln (FS) and the limit
state.
If a probability of failure value is desired, a
B-4. Steps in a Reliability Analysis Using the
distribution is assumed and Pr(f) calculated.
Capacity-Demand Model
As suggested by Figure B-1 for slope stability, a
B-5. Random Variables
reliability analysis includes the following steps:
a. Description. Parameters having significance
Important variables considered to have
in the analysis and some significant uncertainty are
sufficient inherent uncertainty are taken as
taken as random variables. Instead of having precise
random variables and characterized by their
single values, random variables assume a range of
expected values, standard deviations, and
values in accordance with a probability density
correlation coefficients. In concept, every
B-3


 Previous Page
