ETL 1110-2-547
30 Sep 95
the combined effect of how two variables vary
the normal or lognormal distribution which has the
together. The definition of the covariance is:
expected value and standard deviation assumed. This
can easily be done with spreadsheet software.
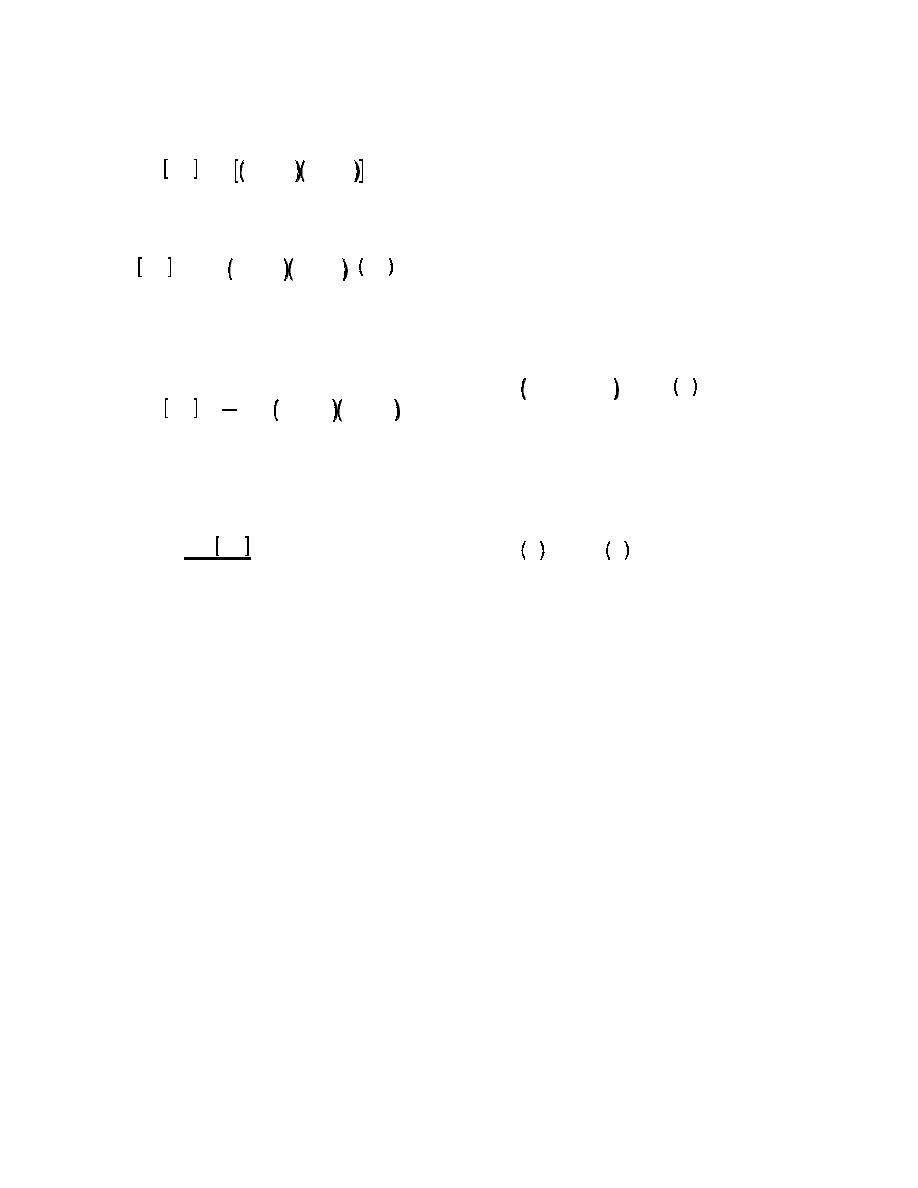
Cov X,Y ' E X & X Y & Y
(2) Figure B-1 illustrated probability density
functions for the random variables c and N. A
which is equivalent to:
probability density function has the property that for
any X, the value of f(x) is proportional to the like-
lihood of X. The area under a probability density
mm
Cov X,Y '
X & X Y & Y f X,Y dY dX
function is unity. The probability that the random
variable X lies between two values X1 and X2 is the
integral of the probability density function taken
In the above equation, f(X,Y) is the joint probability
between the two values. Hence:
density function of the random variables X and Y. To
calculate the covariance from data, the following
equation can be used:
X2
m
Pr X1 < X < X2 '
fX X dx
j Xi & X Yi & Y
1
Cov X,Y '
X1
N
(3) The cumulative distribution function CDF or
To provide a nondimensional measure of the degree of
correlation between X and Y, the correlation coefficient
function from minus infinity to X:
DX,Y is obtained by dividing the covariance by the
product of the standard deviations:
X
m
Cov X,Y
FX X '
fX X dx
DX,Y '
FX FY
&4
The correlation coefficient may assume values from
-1.0 to +1.0. A value of 1.0 or -1.0 indicates there is
random variable X is less than the given x.
perfect linear correlation; given a value of X, the value
of Y is known and hence is not random. A value of
b. Estimating probabilistic distributions. A
zero indicates no linear correlation between variables.
suggested method to assign or check assumed
A positive value indicates the variables increase and
moments for random variables is to:
decrease together; a negative value indicates that one
variable decreases as the other increases. Pairs of
Assume trial values for the expected value and
independent random variables have zero correlation
standard deviation and take the random
coefficients.
variable to be normal or lognormal.
Plot the resulting density function and tabulate
B-6. Probability Distributions
and plot the resulting cumulative distribution
function (spreadsheet software is a convenient
a. Definition.
way to do this).
(1) The terms probability distribution and proba-
Assess the reasonableness of the shape of the
bility density function pdf or the notation fX(X) refer to
pdf and the values of the CDF.
a function that defines a continuous random variable.
The Taylor's series and point estimate methods
Repeat above steps with successively
described herein to determine moments of performance
improved estimates of the expected value and
functions require only the mean and standard deviation
standard deviation until an appropriate pdf and
of random variables and their correlation coefficients;
CDF are obtained.
knowledge of the form of the probability density
function is not necessary. However, in order to ensure
c. Normal distribution. The normal or Gaussian
that estimates made for these moments are reasonable,
distribution is the most well-known and widely
it is recommended that the engineer plot the shape of
B-5


 Previous Page
