ETL 1110-2-547
30 Sep 95
m
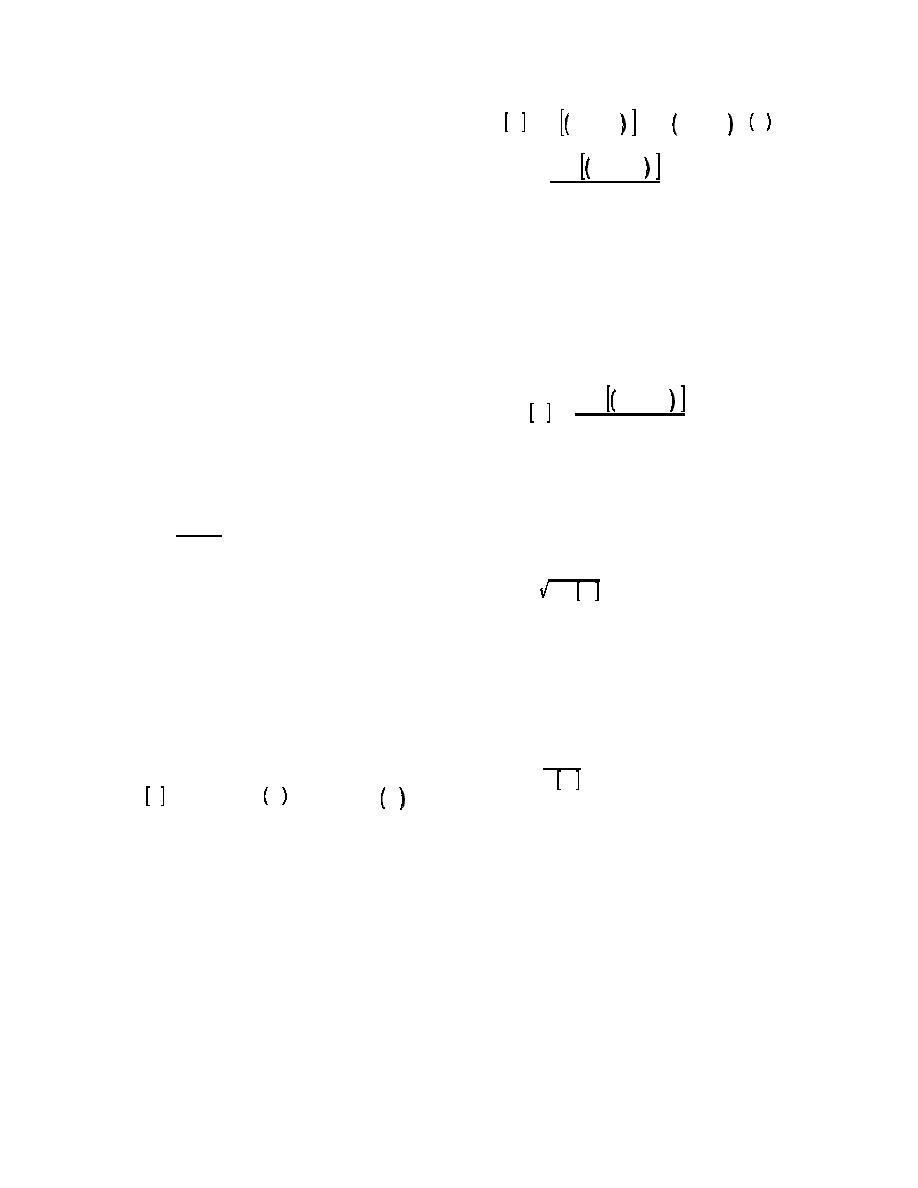
Var X ' E X & X
X & X 2 f X dX
2
'
distribution quantifies the likelihood that its value lies
in any given interval. Two commonly used distri-
j
Xi & X
2
butions, the normal and the lognormal, are described
'
later in this appendix.
N
b. Moments of random variables. To model
The summation form above involving the Xi term
random variables in the Taylor's series or point
provides the variance of a population containing
estimate methods, one must provide values of their
exactly N elements. Usually, a sample of size N is
expected values and standard deviations, which are
used to obtain an estimate of the variance of the
two of several probabilistic moments of a random
associated random variable which represents an entire
variable. These can be calculated from data or esti-
population of items or continuum of material. To
mated from experience. For random variables which
obtain an unbiased estimate of the population working
are not independent of each other, but tend to vary
from a finite sample, the N is replaced by N - 1:
together, correlation coefficients must also be
assigned.
j
Xi & X
2
(1) Mean value. The mean value X of a set of N
Var X '
N&1
measured values for the random variable X is obtained
by summing the values and dividing by N:
(4) Standard deviation. To express the scatter or
dispersion of a random variable about its expected
j Xi
N
value in the same units as the random variable itself,
the standard deviation FX is taken as the square root of
i'1
X '
the variance; thus:
N
Fx ' Var X
(2) Expected value. The expected value E[X] of a
random variable is the mean value one would obtain if
all possible values of the random variable were multi-
(5) Coefficient of variation. To provide a
plied by their likelihood of occurrence and summed.
convenient dimensionless expression of the uncertainty
Where a mean value can be calculated from
inherent in a random variable, the standard deviation is
representative data, it provides an unbiased estimate of
divided by the expected value to obtain the coefficient
the expected value of a parameter; hence, the mean
of variation VX which is usually expressed as a percent:
and expected value are numerically the same. The ex-
pected value is defined as:
FX
VX '
100 %
EX
X f X dx . j Xp Xi
m
E X ' X '
The expected value, standard deviation, and coefficient
of variation are interdependent: knowing any two, the
where
third is known. In practice, a convenient way to
estimate moments for parameters where little data are
f(X) = probability density function of X (for
available is to assume that the coefficient of variation is
continuous random variables)
similar to previously measured values from other data
sets for the same parameter.
random variables)
c. Correlation. Pairs of random variables may
(3) Variance. The variance Var [X] of a random
be correlated or independent; if correlated, the like-
variable X is the expected value of the squared
lihood of a certain value of the random variable Y
difference between the random variable and its mean
depends on the value of the random variable X. For
value. Where actual data are available, the variance of
example, the strength of sand may be correlated with
the data can be calculated by subtracting each value
density or the top blanket permeability may be corre-
from the mean, squaring the result, and determining
lated with grain size of the sand. The covariance
the average of these values:
Cov [X,Y] is analogous to the variance but measures
B-4


 Previous Page
