
ETL 1110-2-563
30 Sep 04
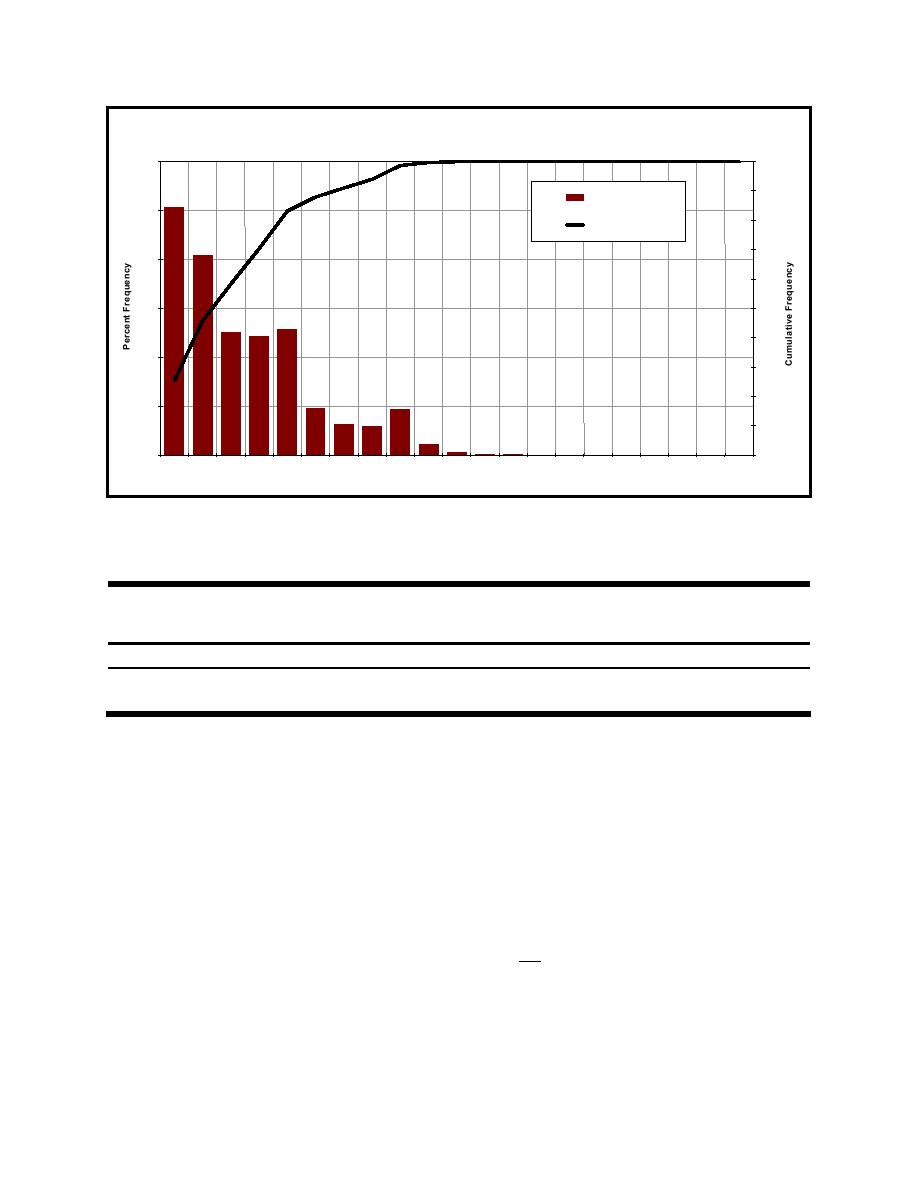
Downbound Lockages - Kentucky Lock (1991 - 1997)
Commercial Tows with Barges
30.0%
100.0%
90.0%
25.0%
80.0%
Cumulative %
70.0%
20.0%
60.0%
15.0%
50.0%
40.0%
10.0%
30.0%
20.0%
5.0%
10.0%
.0%
.0%
9,000
12,000
15,000
18,000
21,000
24,000
27,000
30,000
33,000
36,000
39,000
42,000
45,000
48,000
51,000
54,000
57,000
60,000
More
6,000
<3,000
Weight Distribution of Downbound Tows (s.tons)
Figure C-15. Histogram of cumulative probability distribution of downbound lockages at Kentucky Locks
upper landside guide wall
Table C-3
Lognormal Distribution Parameters for Impact Variables at Kentucky L&D Upper
Approach Guide Wall
Design Structure
Variable
Mean
Standard Deviation
Minimum
Maximum
θ, deg
Upper landside guide wall
6.15
2.5
0
27
V, ft/sec
1.4
0.7
0
5
(2) Scale model experiments at 1:120 were performed at ERDC to determine the approach velocities
and angles of impact for both a nine-barge jumbo tow and an existing design five-barge tow. These
experiments were laid out for various flow conditions to cover a range of hydraulic conditions as well as
for the loss of power condition of a nine-barge tow. The flow regime for the scale model is shown in
Figure C-18.
(3) Overall, five scale model testing sequences were recommended and are summarized in Table C-4.
These testing sequences assisted in defining the annual probability distributions for a wide range of flows
and events. An example of the statistical parameters for a 708-cu-m/sec (25,000-cu-ft/sec) flow using five
standard barges is shown in Table C-5. The velocities results for these experiments were determined as
both normal Vn and tangential Vt velocities to the wall and are not in barge coordinates. The correlation
coefficients of the random variables from the testing data for this event are shown in Table C-6. For
information on the distributions for the other testing sequences, correlation coefficients, or raw experi-
ment data, additional details can be found in Patev (2000).
C-11

 Previous Page
