
ETL 1110-2-563
30 Sep 04
Upbound Landings - Greenup Lock (1992 - 1998)
Commercial Tows with Barges
7,000
120%
6,500
6,000
100%
5,500
5,000
80%
4,500
4,000
ds
Cumulative %
60%
3,500
3,000
2,500
40%
2,000
1,500
20%
1,000
500
-
0%
<3000
6000
9000
12000
15000
18000
21000
24000
27000
30000
33000
36000
39000
42000
Weight Distribution of Upbound Tows (s.tons)
Figure C-25. Histogram of upbound tow weight distribution for Greenup L&D
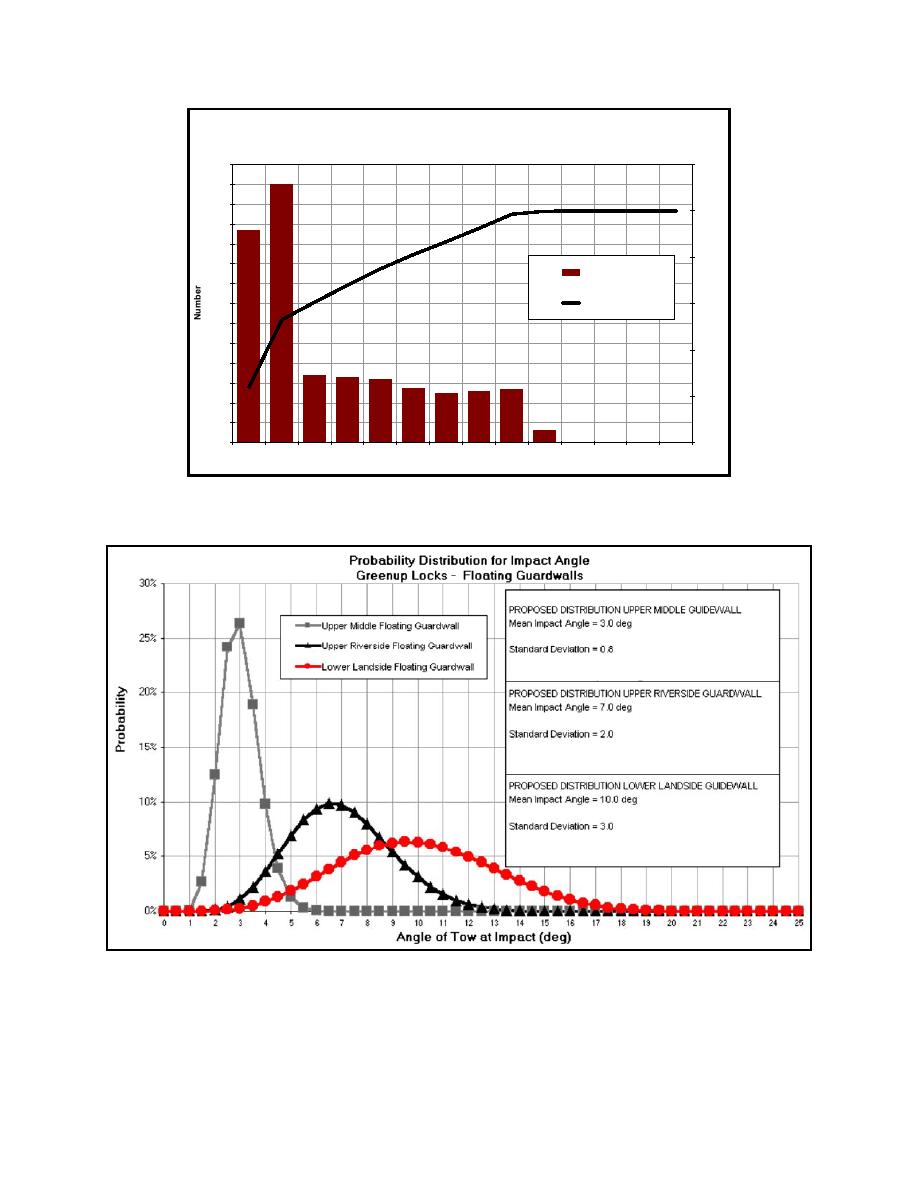
Figure C-26. Probability distributions for impact angle at Greenup L&D
C-18

 Previous Page
