
ETL 1110-2-563
30 Sep 04
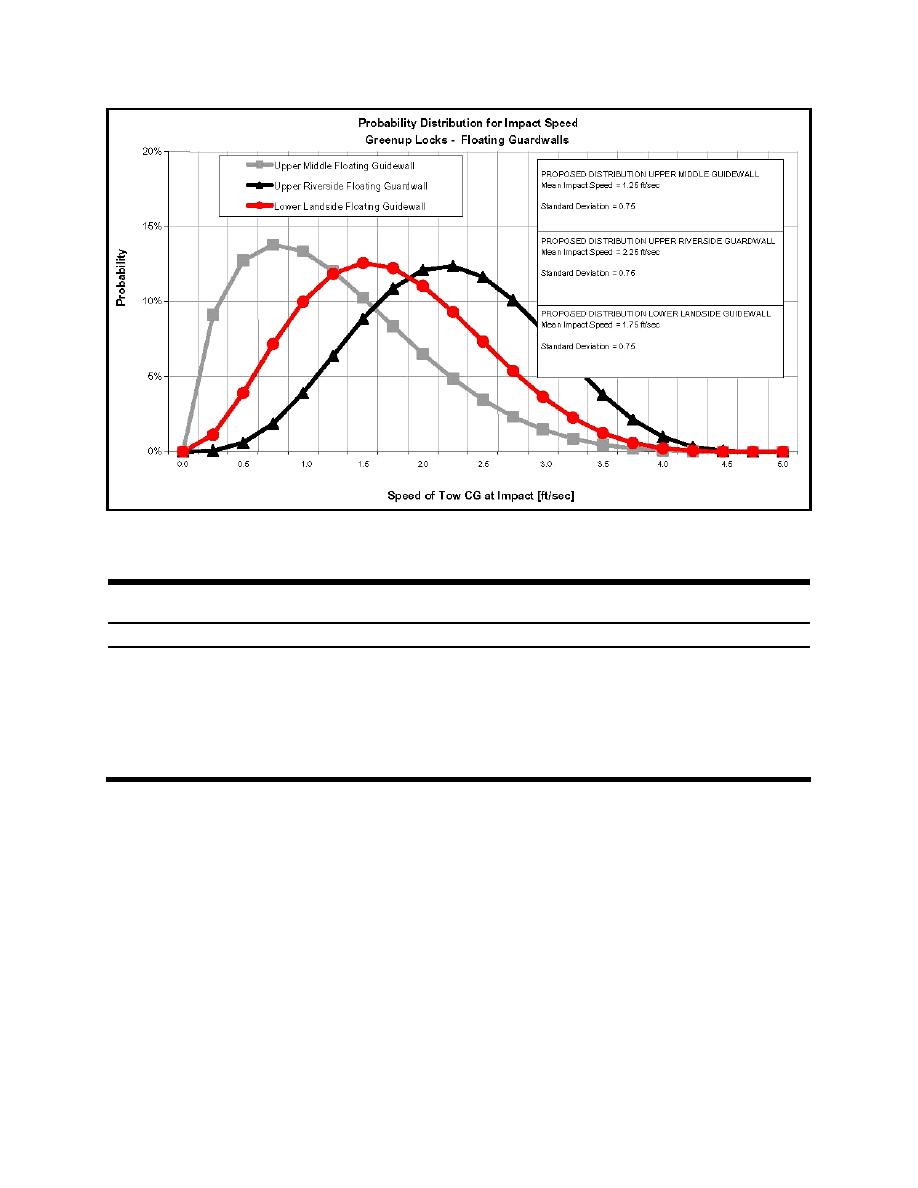
Figure C-27. Probability distributions for forward velocity at Greenup L&D
Table C-8
Lognormal Distribution Parameters for Impact Variables at Greenup L&D
Design Structure
Variable
Mean
Standard Deviation
Minimum
Maximum
θ, deg
Upper middle wall (downbound)
3.0
0.8
0
6
V, ft/sec
1.25
0.75
0
5
θ, deg
Upper riverside wall (downbound)
7.0
2.0
0
22
V, ft/sec
2.25
0.75
0
5
θ, deg
Lower landside wall (upbound)
10.0
3.0
0
25
V, ft/sec
1.75
0.75
0
5
C-19

 Previous Page
